Chapitre 247 Figures · Complet A-Z Guide · Single, Double & Trois chandelless
Figures en chandeliers Figures
Un guide complet des figures en chandeliers : chaque figure est expliquée avec des schémas SVG, la psychologie de chaque bougie et des règles de configuration de trade. Des bases aux notions avancées.
47
Figures
47
Graphiques SVG
A-Z
Complet
Pro
Niveau
📖 Pourquoi les chandeliers sont importants
Chandellestick charts were invented by Japanese rice trader Homma Munehisa in the 1700s. He discovered that market prixs are not just driven by supply and demand — but also by émotions des traders. Every chandelle tells you 4 crucial things:
O
Ouverture
Prix d’ouverture
H
plus haut
plus hautest reached
L
plus bas
plus basest reached
C
Clôture
Prix de clôture
🔑 Principe clé : Une figure en chandeliers n’a de sens que lorsqu’elle apparaît à un niveau de prix clé (support, résistance ou point de swing majeur). Un marteau sans contexte est peu pertinent. Un marteau sur un support clé peut offrir une configuration plus intéressante.
🕯️ Anatomie of a Chandellestick
Chaque chandelier possède 3 parties: the Corps, mèche supérieure, and mèche inférieure. The body shows the range between Ouverture and Clôture. Mèches show how far prix went beyond the body but was rejected.
Vert / Haussier
Clôture ABOVE Ouverture. acheteurs won the séance.
Rouge / Baissier
Clôture BELOW Ouverture. vendeurs won the séance.
Mèche
Le prix a atteint ce niveau puis a été rejeté. Une longue mèche indique un rejet marqué.
📊 Schéma complet de l’anatomie
Single Figures en chandeliers
Neutre / Retournement
Famille des Doji
Un Doji se forme lorsque Ouverture ≈ Clôture. It shows temporary balance or indecision, not an automatic reversal. Its meaning depends on the preceding trend, nearby levels and what prix does next.
1. Doji classique
Ouverture = Clôture. Equal wicks above and below. Neither acheteurs nor vendeurs won. Perfect balance.
📍 Signal : Wait for next chandelle to confirm direction.
2. Doji libellule 🐉
Ouverture = Clôture = plus haut. Very long lower wick. acheteurs completely rejected le plus bas prixs and pushed prix back to the top.
📍 Entrée: ACHAT above next bullish chandelle. SL below the Doji low.
3. Doji pierre tombale ⚰️
Ouverture = Clôture = plus bas. Long upper wick. vendeurs completely rejected le plus haut prixs and pushed back down to the bottom.
Very long wicks both ways, tiny/no body. Wild séance — both sides tried but failed. Market is confused.
📍 Signal : Un mouvement important pourrait se préparer. Surveillez une cassure.
5. Four Prix Doji
Ouverture = plus haut = plus bas = Clôture. Just a flat horizontal line. Extremely rare. Seen in very low-volume markets or news lockdown periods.
📍 Signal : Complet market halt. Avoid trading.
Signaux de retournement
Famille des marteaux
Les figures de marteau présentent un petit corps et une longue mèche d’un côté. They signal strong rejection of a prix level. The SAME shape can be bullish or bearish depending on where it appears in the trend.
6. Marteau 🔨
Small body at top. Long lower wick = 2x or 3x the body size. acheteurs pushed prix back up from a low. Found at the bas d’une tendance baissière.
📍 Entrée: ACHAT above next green chandelle. SL = below hammer low.
7. Marteau inversé
Small body at bottom. Long upper wick. acheteurs tried to push higher. Appears at bas d’une tendance baissière. Moins fiable que le marteau classique : une confirmation est nécessaire.
📍 Entrée: Wait for next green chandelle to confirm before buying.
8. Pendu 🪝
Même forme que le marteau, mais apparaît au sommet d’une tendance haussière. vendeurs tested lower prixs. Weakness is showing — trend may reverse down.
📍 Entrée: VENTE below next red chandelle. SL above Pendu high.
9. Étoile filante ⭐
Petit corps situé en bas. La longue mèche supérieure mesure au moins deux fois le corps. À sommet d’une tendance haussière. vendeurs strongly rejected higher prixs. A possible bearish rejection signal; confirm with location, trend context and follow-through.
📍 Entrée: VENTE on next red chandelle. SL above Étoile filante high.
Dynamique
Marubozu
Marubozu signifie « chauve » en japonais — no wicks at all. This is a strong momentum chandelle in which one side controlled most or all of the chandelle range. It does not guarantee continuation.
10. Haussier Marubozu
Aucune mèches. Ouverture at plus bas, Clôture at plus haut. 100% acheteurs controlled the séance. Strong momentum — more upside expected.
Corps itself becomes key support zone. Buy pullbacks to this body.
11. Baissier Marubozu
Aucune mèches. Ouverture at plus haut, Clôture at plus bas. 100% vendeurs controlled. Strong bearish momentum — more downside expected.
Corps becomes key resistance. Sell any rally into this body zone.
Indécision & Dynamique
Spinning Top & Belt Hold
12. Spinning Top (Haussier)
Small body, equal wicks both sides. Both acheteurs and vendeurs active but neither dominates. Market is hesitating.
Sur un support, un retournement haussier est possible.
13. Spinning Top (Baissier)
Même configuration que la version haussière, mais avec un corps rouge. Sur une résistance, elle peut annoncer un retournement baissier.
Sur une résistance, un retournement baissier est possible.
14. Haussier Belt Hold
Ouverture at le plus bas of the séance (no lower wick), closes near le plus haut. Strong bullish chandelle. acheteurs controlled from the very open.
📍 Haussier signal. Enter ACHAT on next chandelle.
15. Baissier Belt Hold
Ouverture at le plus haut of the séance (no upper wick), closes near le plus bas. vendeurs controlled from the very open. Signal baissier marqué.
📍 Baissier signal. Enter VENTE on next chandelle.
Double Figures en chandeliers
Retournement marqué
Engulfing Figures
L’un des parmi les plus fiables et les plus utilisées reversal patterns. The second chandelle completely engulfs (covers) the entire body of the first chandelle — showing a complete shift in who is in control.
16. Haussier Engulfing 🟢
At the bas d’une tendance baissière: green chandelle's body fully covers the previous red chandelle's body. acheteurs took complete control. Potential bullish reversal; wait for confirmation and assess the surrounding market structure.
✅ Entrée: ACHAT on close of green chandelle
🛑 SL: Below le plus bas of the pattern
🎯 TP : prochaine résistance ; ne prenez la configuration que si l’objectif offre un ratio rendement/risque acceptable.
17. Baissier Engulfing 🔴
At the top of an uptrend: red chandelle's body fully covers the previous green chandelle's body. vendeurs took complete control. Potential bearish reversal; wait for confirmation and assess the surrounding market structure.
✅ Entrée: VENTE on close of red chandelle
🛑 SL: Above le plus haut of the pattern
🎯 TP : prochain support ; ne prenez la configuration que si l’objectif offre un ratio rendement/risque acceptable.
Retournement (confirmation nécessaire)
Harami Figures
« Harami » signifie enceinte en japonais. The first chandelle is large, the second is small and fits inside the first chandelle's body like a baby. It signals momentum is fading but needs confirmation.
18. Haussier Harami
Large red chandelle, then small green inside it. Baissier momentum slowing. At support = possible bottom. Needs next chandelle to confirm.
Wait for 3rd green chandelle. Then ACHAT.
19. Baissier Harami
Large green chandelle, then small red inside it. Haussier momentum slowing. At resistance = possible top. Needs next chandelle to confirm.
Wait for 3rd red chandelle. Then VENTE.
20. Haussier Harami Cross
Same as Haussier Harami but the second chandelle is a Doji. Stronger signal because the Doji shows complete indecision after the strong sell.
Signal de retournement haussier plus fort que le Harami classique.
21. Baissier Harami Cross
Same as Baissier Harami but the second chandelle is a Doji. Stronger bearish signal because Doji shows complete indecision after the strong buy.
Signal de retournement baissier plus fort que le Harami classique.
Retournement précis
Tweezer Figures
Two chandelles form near-equal highs (Pince haute) or lows (Pince basse). Prix has tested a similar area more than once; this can signal rejection, but does not prove institutional activity.
22. Pince basse 📌
Both chandelles reach the same low. Prix tested that level twice and was rejected. Strong acheteurs at that exact prix. ACHAT above 2nd chandelle. SL below twin lows.
23. Pince haute 📌
Both chandelles reach the same high. Prix tried to break higher twice but was rejected. Strong vendeurs defending that level. VENTE below 2nd chandelle. SL above twin highs.
Retournement modéré
Ligne pénétrante & Couverture en nuage noir
24. Ligne pénétrante
Large red chandelle. Then green chandelle opens BELOW the red's low but closes ABOVE 50% of the red body. acheteurs fighting back. ACHAT on confirmation.
25. Couverture en nuage noir
Large green chandelle. Then red chandelle opens ABOVE the green's high but closes BELOW 50% of the green body. vendeurs fighting back. VENTE on confirmation.
Most Powerful 2-Chandelle
Kicker Figures
A Kicker is a gap-based two-chandelle pattern in which the second chandelle opens sharply in the opposite direction. It may reflect a sudden sentiment shift, often around news. True gaps are uncommon in spot forex and can later be retested.
26. Haussier Kicker 🚀
A red chandelle, then prix gaps UP and opens as a bullish (green) chandelle. The gap is never retested. Extremely bullish signal. Often appears after news.
27. Baissier Kicker 📉
A green chandelle, then prix gaps DOWN and opens as a bearish (red) chandelle. The gap is never retested. Extremely bearish signal. L’un des strongest sells.
Retournement
Lignes de rencontre (contre-attaque)
Two chandelles where the second chandelle closes at the same prix as the first. After an opposite-colored large chandelle, the second chandelle reverses and closes at the same level.
28. Haussier Meeting Lines
After a large red chandelle, the green chandelle opens lower but closes at the SAME prix as the red chandelle. acheteurs absorbed all the selling pressure. Haussier reversal signal.
29. Baissier Meeting Lines
After a large green chandelle, the red chandelle opens higher but closes at the SAME prix as the green chandelle. vendeurs absorbed all the buying pressure. Baissier reversal signal.
Triple Figures en chandeliers
Potential Retournement
Star Figures
Star patterns are 3-chandelle formations and among the les signaux de retournement les plus fiables de l’analyse technique. Elles sont suivies par des traders institutionnels dans le monde entier.
30. Étoile du matin ⭐ (Haussier)
1
Large bearish chandelle — vendeurs in full control
2
Small chandelle (star) — indecision, vendeurs losing power
3
Large bullish chandelle closing above midpoint of chandelle 1
✅ Entrée: ACHAT on close of chandelle 3 🛑 SL: Below chandelle 2 low 🎯 TP : prochaine résistance pertinente ; vérifiez que le ratio rendement/risque prévu est acceptable.
31. Étoile du soir 🌙 (Baissier)
1
Large bullish chandelle — acheteurs in full control
2
Small chandelle at top — indecision, acheteurs exhausted
3
Large bearish chandelle closing below midpoint of chandelle 1
✅ Entrée: VENTE on close of chandelle 3 🛑 SL: Above chandelle 2 high 🎯 TP : prochain support pertinent ; vérifiez que le ratio rendement/risque prévu est acceptable.
32. Étoile du matin avec Doji ⭐ (plus forte)
Same as Étoile du matin but the middle chandelle is a Doji (perfect indecision). The reversal signal is significantly stronger because the Doji shows vendeurs completely lost control before acheteurs took over.
Stronger than regular Étoile du matin. Enter ACHAT on chandelle 3 close.
33. Étoile du soir avec Doji 🌙 (plus forte)
Same as Étoile du soir but the middle chandelle is a Doji (perfect indecision). Much stronger bearish reversal because the Doji shows acheteurs completely lost control before vendeurs took over.
Stronger than regular Étoile du soir. Enter VENTE on chandelle 3 close.
Continuation de tendance
Three Soldiers & Three Crows
34. Trois soldats blancs 🏹
3 consecutive large green chandelles, each closing higher than the previous and each opening within the prior body. Strong uptrend continuation. Ne poursuivez pas le prix : attendez un repli pour acheter.
35. Trois corbeaux noirs 🦅
3 consecutive large red chandelles, each closing lower. Strong downtrend signal. Appears after a top or during a breakdown. Sell any rally. Baissier momentum is very strong.
Confirmed Retournement
Three Inside & Three Outside
Il s’agit de figures Harami et d’engloutissement confirmed by a 3rd chandelle. Elles sont bien plus fiables, car le retournement est confirmé et non simplement potentiel.
36. Trois chandeliers intérieurs haussiers
Red → Small Green inside → Grande chandelle verte breaking above. Confirmed bullish reversal. Enter ACHAT on 3rd chandelle close.
37. Trois chandeliers intérieurs baissiers
Green → Small Red inside → Grande chandelle rouge breaking below. Confirmed bearish reversal. Enter VENTE on 3rd chandelle close.
38. Trois chandeliers extérieurs haussiers
Haussier Engulfing (2 chandelles) then a 3rd chandelle that closes even higher = confirmed uptrend reversal. Most reliable of the three-chandelle bullish patterns.
Engulfing + confirmation = a possible ACHAT setup, sans garantie.
39. Trois chandeliers extérieurs baissiers
Baissier Engulfing (2 chandelles) then a 3rd chandelle that closes even lower = confirmed downtrend reversal. Most reliable of the three-chandelle bearish patterns.
Engulfing + confirmation = a possible VENTE setup, sans garantie.
Rare et particulièrement marquante
Bébé abandonné
Le Bébé abandonné est une figure rare de retournement composée de trois chandelles : un Doji est isolé des chandelles voisines par des gaps de chaque côté. Les gaps étant peu fréquents sur le forex au comptant, les exemples parfaits sont rares. Attendez une confirmation : aucune figure ne garantit un résultat.
40. Haussier Bébé abandonné 👶
Large red chandelle → gap down → isolated Doji → gap up → large green chandelle. Both gaps show the Doji is completely isolated. Extremely strong buy signal.
✅ Entrée: ACHAT on close of green chandelle 🛑 SL : sous le plus bas du Doji 🎯 R:R min.: 1:4
41. Baissier Bébé abandonné 👶
Large green chandelle → gap up → isolated Doji → gap down → large red chandelle. Both gaps show the Doji is completely isolated. Extremely strong sell signal.
✅ Entrée: VENTE on close of red chandelle 🛑 SL : au-dessus du plus haut du Doji 🎯 R:R min.: 1:4
Figures rares et avancées
Avancé
Figures rares et avancées
Ces figures sont moins fréquentes, mais apparaissent sur les marchés réels. Les connaître peut enrichir votre analyse au-delà des notions de base.
42. Three Line Strike (Haussier)
3 consecutive red chandelles followed by 1 large green chandelle that engulfs all 3. Counter-intuitive: this is actually a continuation haussière. Les vendeurs s’essoufflent et les acheteurs prennent le dessus.
Potential ACHAT setup after the fourth bullish chandelle closes; wait for confirmation and a suitable entry location.
43. Three Line Strike (Baissier)
Three consecutive bullish chandelles are followed by a large bearish chandelle that reverses the preceding advance. This is the bearish counterpart to the bullish setup; the pattern alone does not prove institutional activity.
Potential VENTE setup after the 4th bearish chandelle closes; wait for confirmation and a suitable entry location.
44. Deux corbeaux après un gap haussier
Large green chandelle, then 2 small red chandelles that gap up but stay above the green chandelle. Baissier reversal forming at the top. The gap is the warning sign — vendeurs appearing despite high prixs.
Baissier reversal. Watch for breakdown below the gap.
45. Sandwich
Red chandelle, then green chandelle, then red chandelle with the SAME closing prix as the first red chandelle. The green is sandwiched. A bullish reversal signal — vendeurs tried twice at the same level and couldn't break lower.
Haussier reversal. Double-bottom forming at same close prix.
46. Bloc d’avancée
Three green chandelles like White Soldiers but each has progressively smaller bodies and longer upper wicks. Shows acheteurs are weakening and losing momentum. Baissier reversal warning — uptrend about to stall.
Signal d’alerte sur une résistance. Réduisez les positions acheteuses et surveillez un retournement.
47. plus haut Wave Chandelle
Small body with extremely long wicks on BOTH sides. Huge volatility with no clear direction. Prix traveled far up AND down but closed near the open. Market is in maximum confusion.
Évitez de trader. Attendez un signal clair : un mouvement important pourrait suivre.
⚡ Module d’entrée
Comment trader les figures en chandeliers
Une figure seule ne suffit pas. C’est la combinaison emplacement + figure + confirmation qui permet d’évaluer une configuration. Utilisez cette méthode en trois étapes :
1
Emplacement
La figure se forme-t-elle sur un support, une résistance ou un niveau de swing majeur ? Une figure située sur une zone importante est généralement plus pertinente que la même forme au milieu d’une consolidation.
2
Figure
La figure est-elle clairement identifiable ? Elle doit montrer un rejet ou un potentiel de retournement au niveau clé. La chandelle doit être clôturée : n’entrez jamais sur une chandelle inachevée.
3
Confirmation
Attendez que la chandelle suivante confirme la direction. Envisagez l’entrée après sa clôture. Évitez de poursuivre le marché : une autre configuration se présentera.
📋 Entrée Cheat Sheet — All Figures
Figure
Signal
Entrée Trigger
Stop loss
R:R min.
Doji libellule
🟢 ACHAT
Above next green chandelle
Sous le plus bas du Doji
1:2
Doji pierre tombale
🔴 VENTE
Below next red chandelle
Au-dessus du plus haut du Doji
1:2
Marteau
🟢 ACHAT
Above next green chandelle
Below Marteau low
1:2
Étoile filante
🔴 VENTE
Below next red chandelle
Au-dessus du plus haut de l’étoile
1:2
Pendu
🔴 VENTE
Below next red chandelle
Above Pendu high
1:2
Haussier Marubozu
🟢 ACHAT
Lors d’un repli vers le corps
Sous le plus bas du Marubozu
1:2
Baissier Marubozu
🔴 VENTE
Lors d’un rebond vers le corps
Au-dessus du plus haut du Marubozu
1:2
Haussier Engulfing
🟢 ACHAT
On close of green chandelle
Sous le plus bas de la figure
1:2
Baissier Engulfing
🔴 VENTE
On close of red chandelle
Au-dessus du plus haut de la figure
1:2
Pince basse
🟢 ACHAT
Above 2nd chandelle close
Sous les deux plus bas
1:2
Pince haute
🔴 VENTE
Below 2nd chandelle close
Au-dessus des deux plus hauts
1:2
Haussier Kicker
🟢 ACHAT
On close of green chandelle
Sous le gap
1:3
Baissier Kicker
🔴 VENTE
On close of red chandelle
Au-dessus du gap
1:3
Étoile du matin
🟢 ACHAT
On close of chandelle 3
Below chandelle 2 low
1:3
Étoile du soir
🔴 VENTE
On close of chandelle 3
Above chandelle 2 high
1:3
Trois soldats blancs
🟢 ACHAT
Buy pullback after 3rd chandelle
Sous le dernier creux significatif
1:2
Trois corbeaux noirs
🔴 VENTE
Sell rally after 3rd chandelle
Au-dessus du dernier sommet significatif
1:2
Bébé abandonné (Bull)
🟢 ACHAT
On close of green chandelle
Sous le plus bas du Doji
1:4
Bébé abandonné (Bear)
🔴 VENTE
On close of red chandelle
Au-dessus du plus haut du Doji
1:4
Frappe de trois lignes (haussière)
🟢 ACHAT
After 4th bullish chandelle closes
Below 4th chandelle low
1:3
❌ À ne jamais faire
✖
Enter before the chandelle closes (pattern must be 100% complete)
✖
Trader une figure sans niveau clé clairement identifié à proximité
✖
Trade against le plus hauter timeframe trend
✖
Entrer sur chaque figure observée (soyez sélectif)
✖
Trader sans stop-loss — jamais, sans exception
✖
Risquer plus de 1 à 2 % de votre compte par transaction
Wait for chandelle to close before entering the trade
✔
Check current London and New York séance times, including daylight-saving changes, and focus on the hours that fit your strategy.
✔
Tenez un journal de trading et analysez chaque transaction
✔
plus hauter timeframe chandelles carry more weight and reliability
Exemples sur graphiques réels
Exemples de graphiques réels — NAS100, XAUUSD & US30
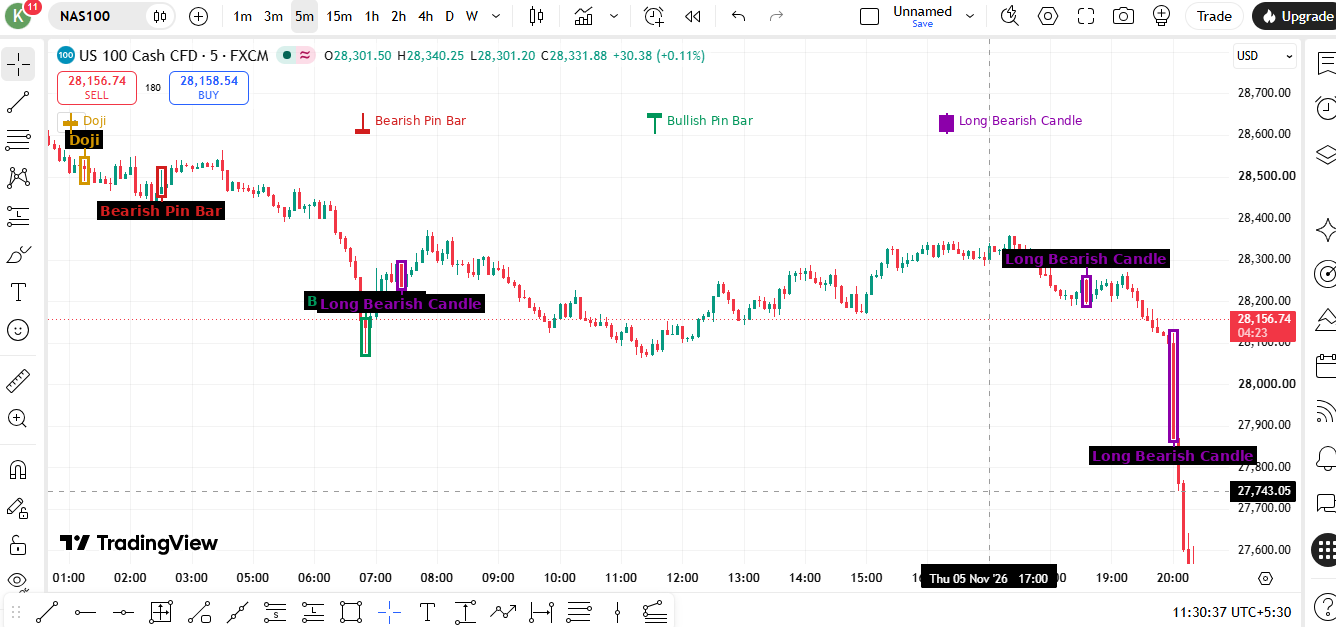
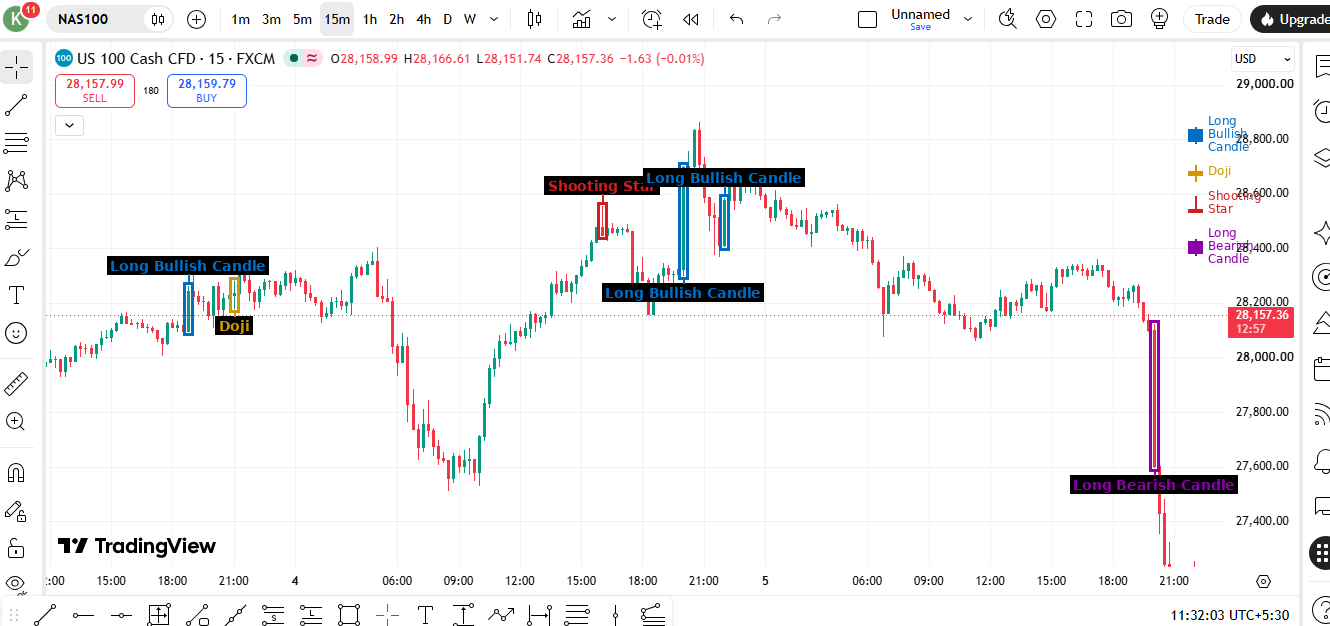
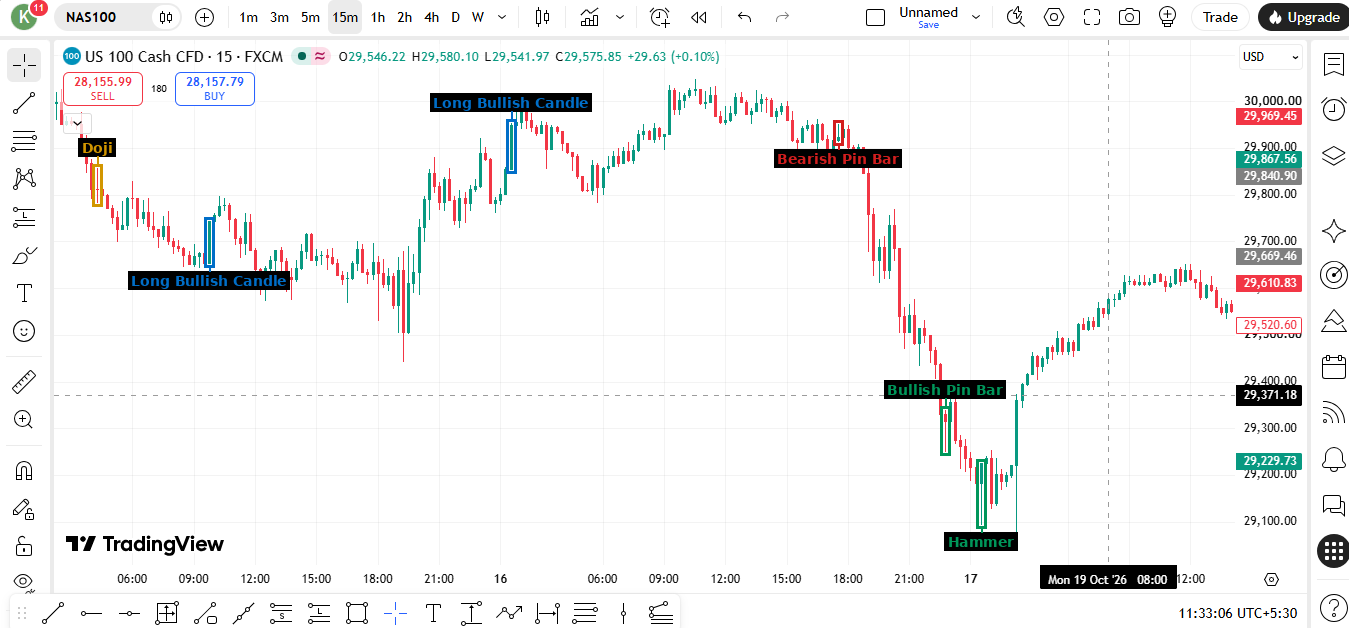
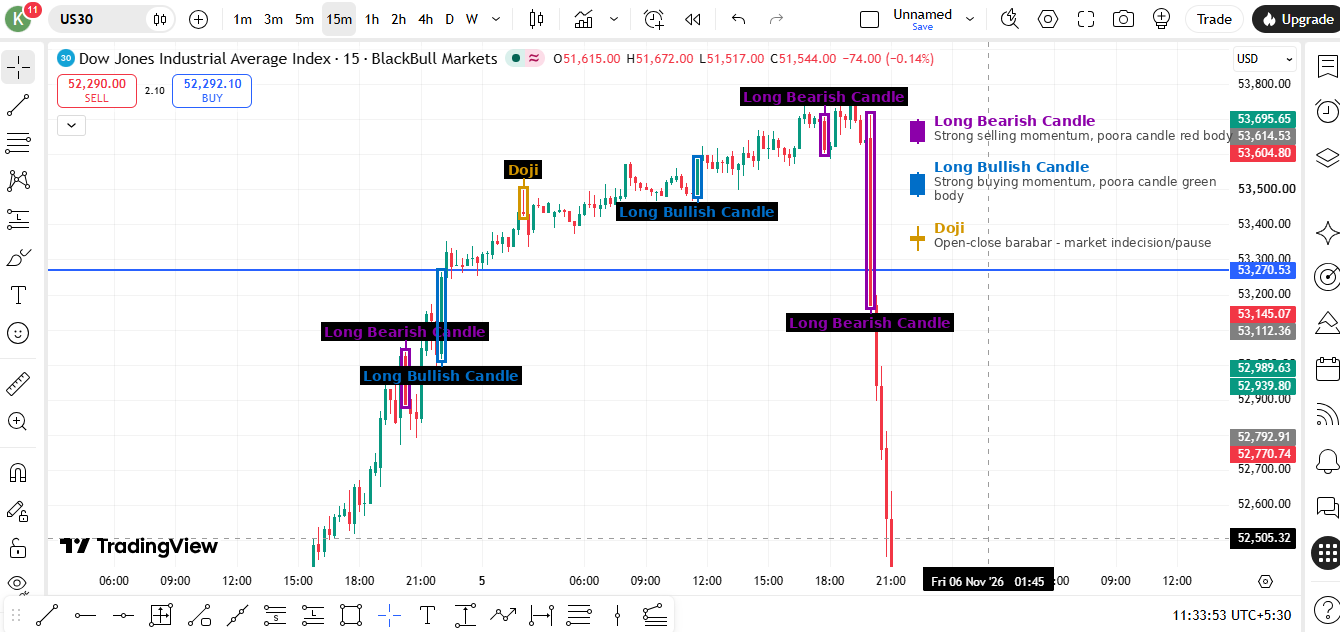
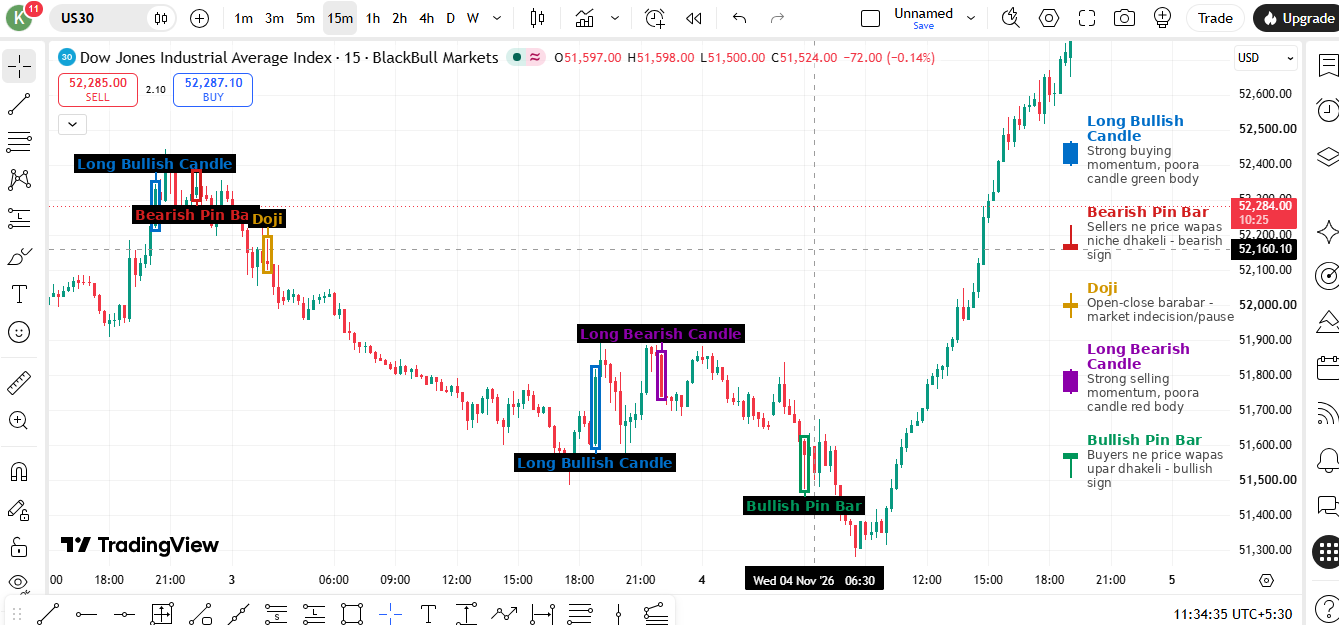
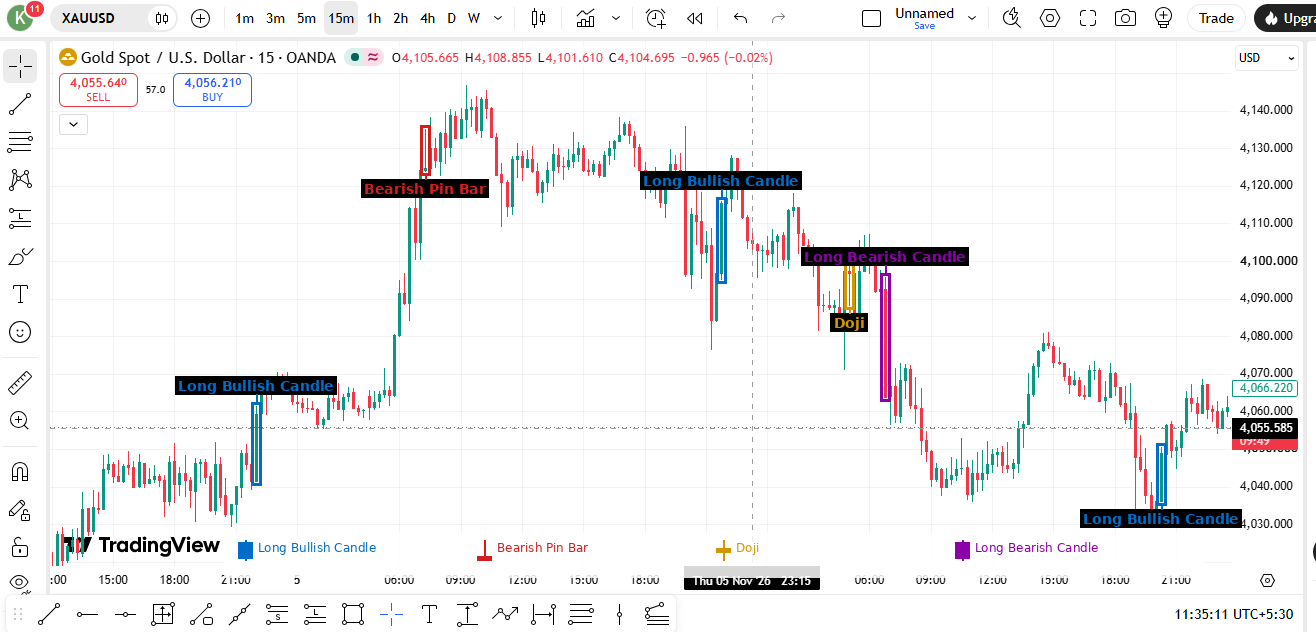
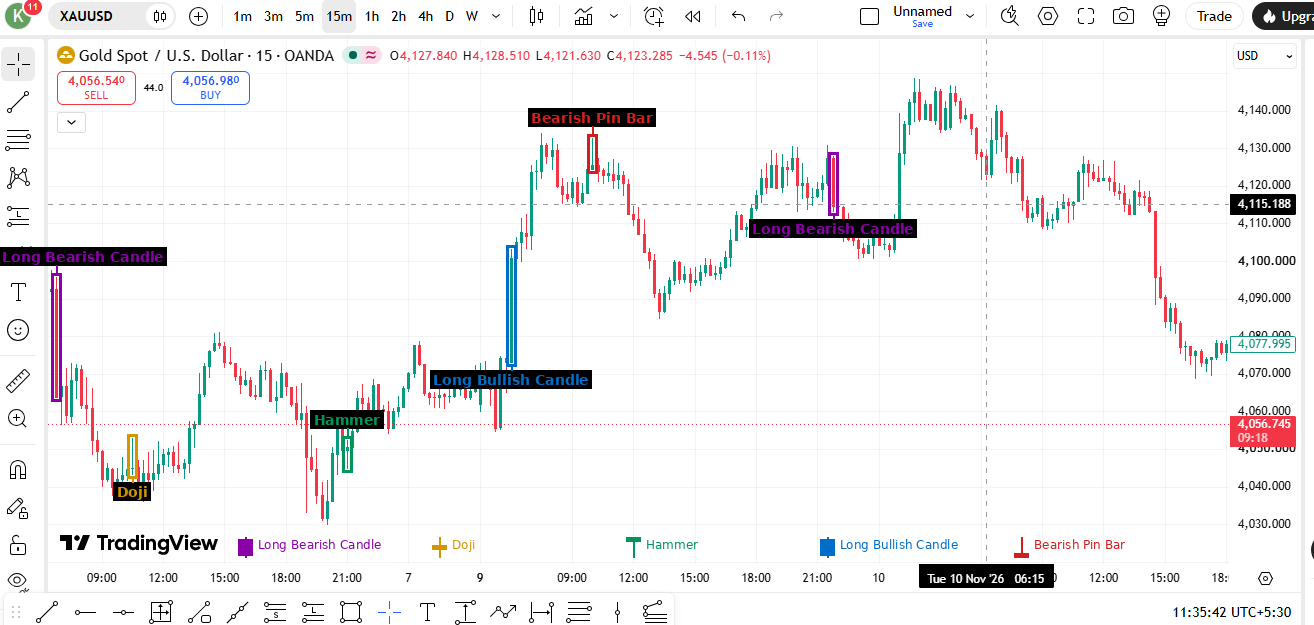
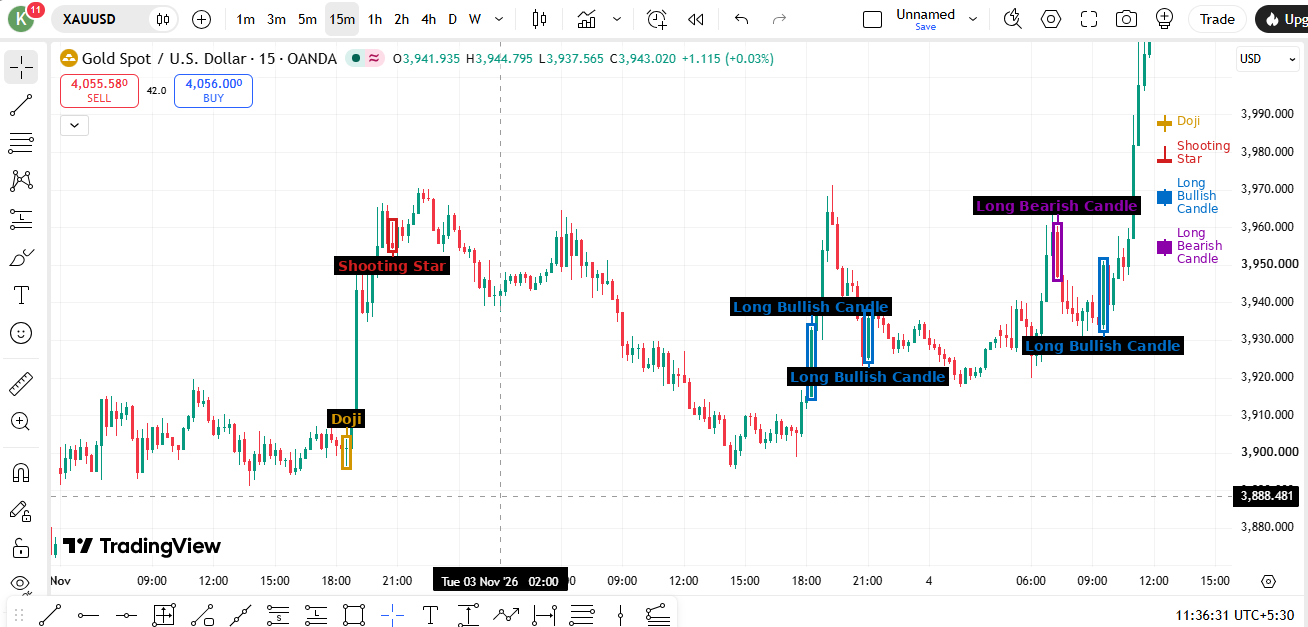
Study how candlestick behaviour appears inside real market movement. These annotated TradingView examples cover long bullish and bearish chandelles, Doji chandelles, Marteau formations, bullish and bearish Pin Bars, and Étoile filantes. Read the surrounding prix action as well as the marked chandelle: context is what turns a chandelle shape into useful information.
01 · NAS100 · 15 minutes
Lire les rejets de prix et le momentum au cours d’une même séance
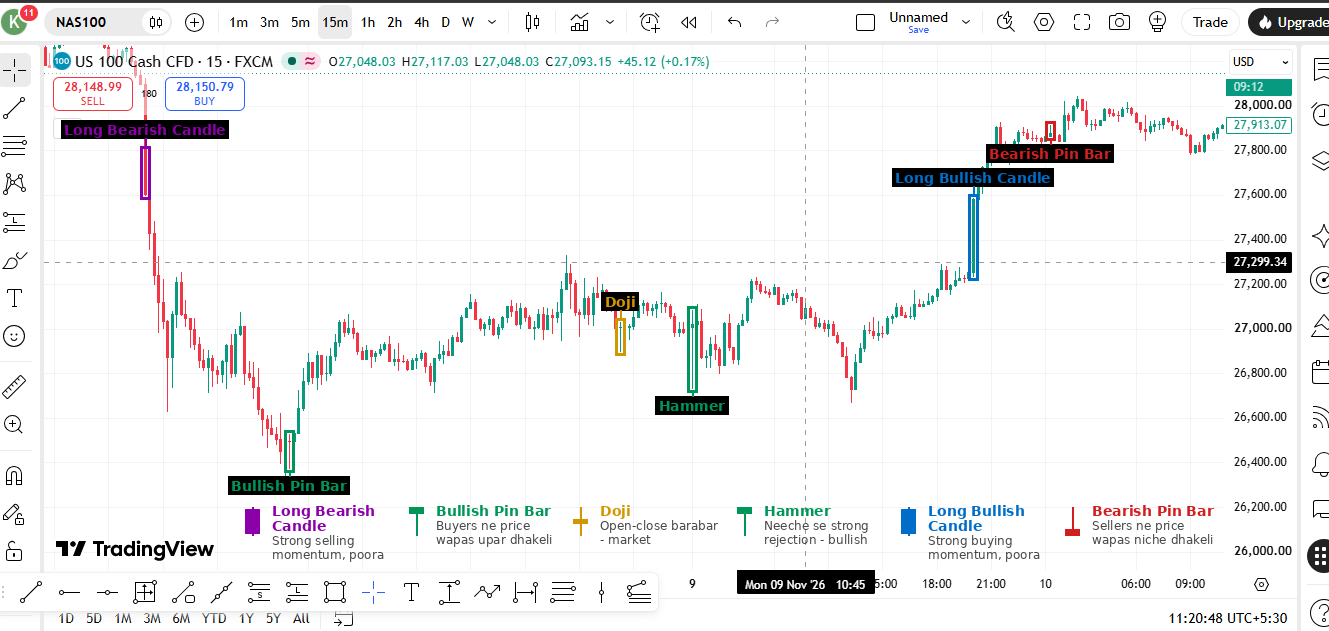
Ce que montre le graphique : A strong bearish chandelle drives prix lower, while a bullish Pin Bar and a Marteau later show rejection from lower prixs. A Doji marks a pause, followed by a long bullish chandelle and a bearish Pin Bar near the later high.
Comment lire ce graphique : The lower-wick rejections suggest acheteurs are defending an area, but the Doji alone is indecision—not a buy signal. The long bullish chandelle shows stronger buying participation; the later bearish Pin Bar warns that acheteurs may be meeting supply.
Confirmation : Look for a close above the rejection chandelle high for bullish follow-through, or a break below the bearish Pin Bar low for bearish follow-through. Always check the nearby swing levels.
02 · NAS100 · 15 minutes
Doji, Étoile filante and Strong Chandelle Expansion
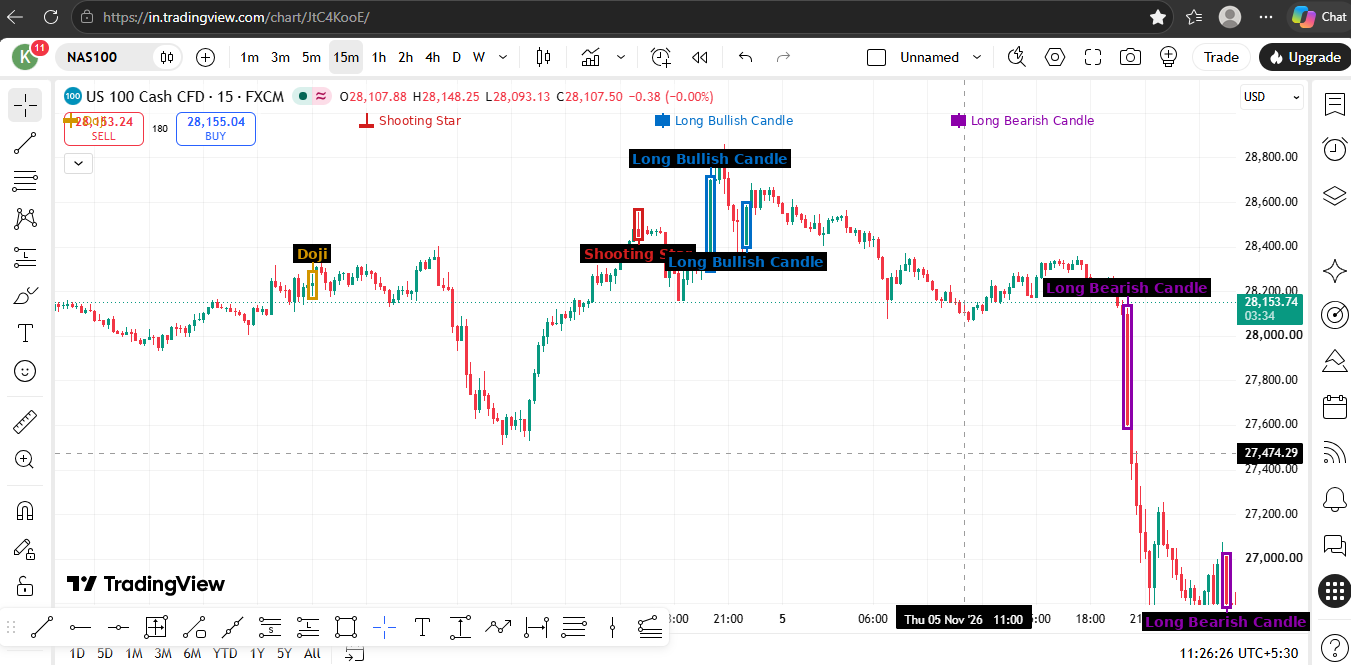
Ce que montre le graphique : A Doji appears during a sideways phase, a Étoile filante is marked after an upward push, and long bullish chandelles appear during the recovery. Long bearish chandelles later accompany a sharp sell-off.
Psychologie du marché : The Doji reflects a temporary balance between acheteurs and vendeurs. The Étoile filante shows an attempt to trade higher that was rejected. Large chandelle bodies show decisive momentum, but do not by themselves prove that a trend will continue.
Confirmation : For a Étoile filante, watch for a bearish close or a break of its low. For continuation haussière, look for prix to hold above the impulse chandelle's base and form a higher low.
03 · NAS100 · 5 minutes
Marteau and Haussier Pin Bar During a Recovery
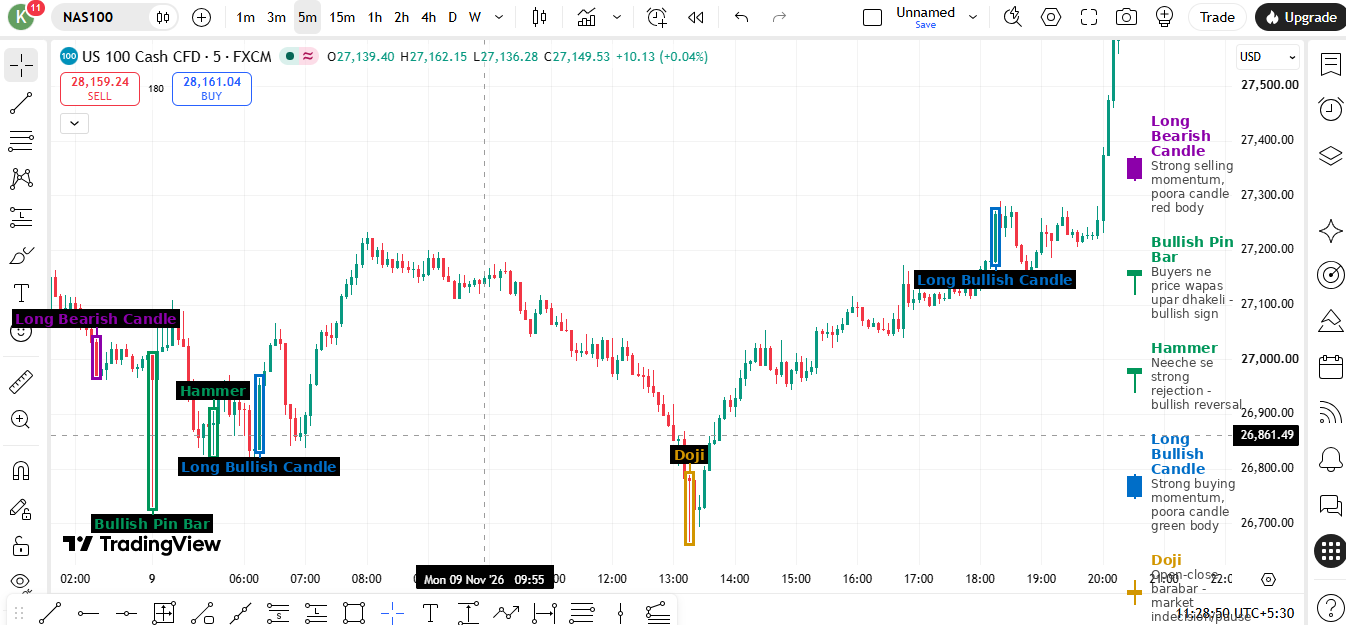
Ce que montre le graphique : A Marteau and a bullish Pin Bar are marked after downward movement, with a Doji appearing near a later intraday low. Long bullish chandelles then appear as prix advances.
Psychologie du marché : The long lower shadows show that vendeurs pushed prix down but could not keep it there. The following bullish expansion suggests acheteurs gained control after the rejection.
Confirmation : A close above the Marteau or Pin Bar high adds evidence of a reversal. A retest that holds the rejection area can offer a more controlled entry than chasing the first large green chandelle.
04 · NAS100 · 5 minutes
Baissier Pressure, Marteau Rejection and Recovery
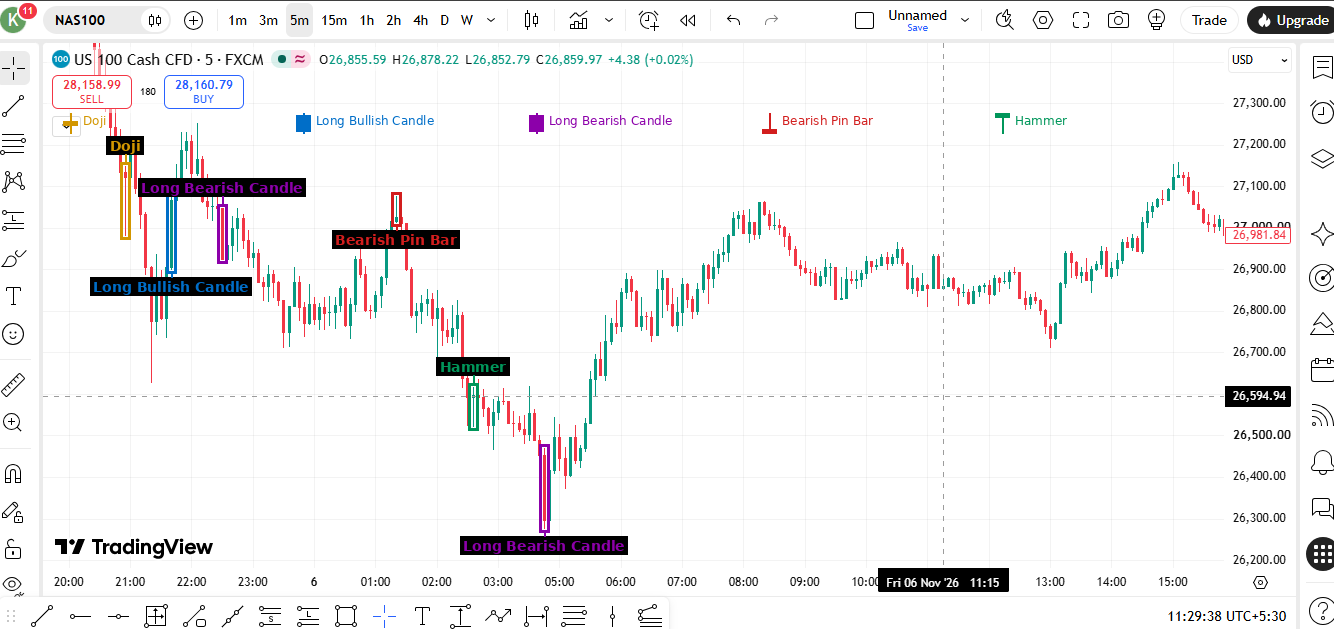
Ce que montre le graphique : Several long bearish chandelles appear during the decline. A Marteau is marked near le plus bas, followed by a strong upward reaction. A bearish Pin Bar is also marked earlier near a local high.
Psychologie du marché : The bearish chandelles show strong selling pressure. Near le plus bas, the Marteau indicates that lower prixs were rejected; the rebound shows acheteurs responding, although the pattern needs confirmation.
Confirmation : Watch whether prix closes above the Marteau high and breaks the nearest lower high. If prix instead breaks the Marteau low, the bullish-reversal idea is invalidated.
05 · NAS100 · 5 minutes
Pin Bar Rejections Inside a Baissier Move
Ce que montre le graphique : A Doji and bearish Pin Bar appear near the early part of the chart. A bullish Pin Bar is marked during a later recovery, while long bearish chandelles appear near the right side before prix drops sharply.
Comment l’interpréter : Une Pin Bar haussière peut provoquer un rebond à court terme sans inverser la structure générale. L’expansion baissière qui suit rappelle qu’il faut distinguer une réaction locale d’un changement de tendance confirmé.
Confirmation : Compare each rejection with the latest swing high and low. A bullish idea needs a higher high or a clear bullish break; a bearish idea gains support if prix breaks the rejection chandelle low.
06 · NAS100 · 15 minutes
Dynamique Chandelles and a Étoile filante at the plus haut
Ce que montre le graphique : Long bullish chandelles appear during an upward leg. A Doji signals a pause, a Étoile filante is marked close to the local high, and a long bearish chandelle appears later as prix sells off.
Psychologie du marché : acheteurs initially move prix higher with strong bodies. The Étoile filante shows rejection of higher prixs, while the later bearish expansion confirms that vendeurs were able to push prix lower in this example.
Confirmation : Do not sell simply because a Étoile filante appears. Wait for a bearish close or a break below its low, ideally with resistance or a prior high nearby.
07 · NAS100 · 15 minutes
Rejets multiples autour des points de retournement intrajournaliers
Ce que montre le graphique : A Doji and bullish Pin Bar appear during the earlier decline. A long bullish chandelle marks a forceful upward move. A bearish Pin Bar near the later high is followed by a sell-off, and a bullish Pin Bar and Marteau appear near le plus bas.
Psychologie du marché : The chart demonstrates that rejection chandelles can appear on both sides of the market. Their meaning depends on location: the bearish rejection near a high precedes weakness, while lower-wick rejections near le plus bas precede a recovery.
Confirmation : Appuyez-vous sur la structure des sommets et des creux voisins. Une configuration haussière devrait reprendre un sommet à court terme ; une configuration baissière devrait casser un creux récent. Ne considérez pas chaque mèche comme un retournement automatique.
08 · US30 · 15 minutes
Dynamique Expansion and a Sharp Baissier Retournement
Ce que montre le graphique : Long bullish chandelles appear as US30 advances through the marked level. A Doji forms near the upper part of the move, followed by long bearish chandelles and a sharp decline.
Psychologie du marché : The bullish impulse reflects strong buying. The Doji indicates hesitation after the advance, but the subsequent bearish expansion—not the Doji alone—is what demonstrates that vendeurs took control in this sample.
Confirmation : Watch for a break of the Doji's local support or a lower high after the pause. A Doji can also precede continuation, so wait for prix to reveal direction.
09 · US30 · 15 minutes
Baissier Pin Bar, Doji and Haussier Rejection
Ce que montre le graphique : A bearish Pin Bar and Doji are marked after an early rise. Long bearish chandelles accompany the decline, while a bullish Pin Bar appears close to le plus bas before a strong recovery and long bullish chandelles.
Psychologie du marché : The upper-wick rejection suggests acheteurs could not hold le plus hauter prixs. Near le plus bas, the bullish Pin Bar shows lower prixs being rejected; the subsequent rally provides follow-through in this example.
Confirmation : For a bullish reversal, look for prix to break a nearby lower high after the Pin Bar. For bearish continuation, a fresh low and failed retest would support the vendeurs' case.
10 · XAUUSD · 15 minutes
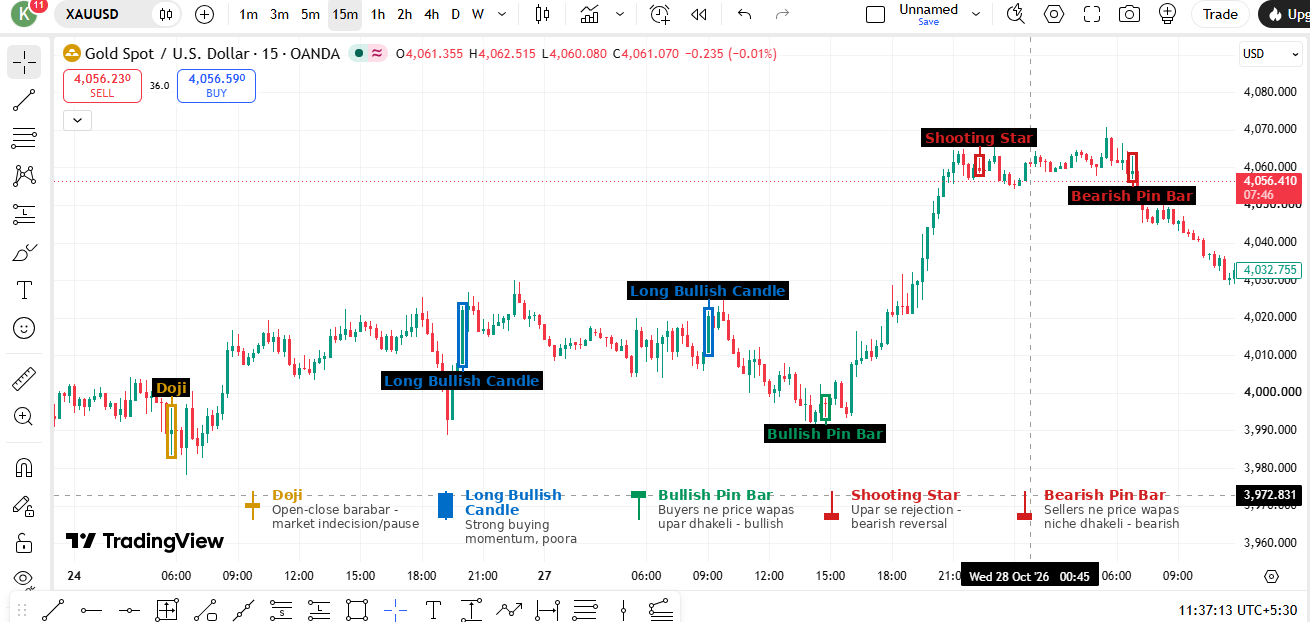
Or : Haussier Impulse Followed by Baissier Rejection
Ce que montre le graphique : A long bullish chandelle appears during an upward push. A bearish Pin Bar is marked near le plus haut, followed by long bearish chandelles and a Doji during the decline. Another long bullish chandelle appears near the later low.
Psychologie du marché : The chart captures a shift from buying momentum to rejection at higher prixs. The Doji during the decline is a pause, while the later bullish chandelle shows a forceful response from lower levels.
Confirmation : At le plus haut, look for a close below the bearish Pin Bar low. Near le plus bas, wait for a bullish close and a structure break before assuming the decline has reversed.
11 · XAUUSD · 15 minutes
Or : Marteau Rejection and Baissier Pin Bar at Resistance
Ce que montre le graphique : A Doji and Marteau are marked after a decline. A long bullish chandelle appears as prix recovers, while a bearish Pin Bar and long bearish chandelle appear around a later high.
Psychologie du marché : The Marteau shows rejection of lower prixs and is followed by a recovery in this sample. At the later high, the bearish Pin Bar signals that upward movement is being rejected.
Confirmation : A bullish close above the Marteau high supports the recovery idea. Near the later high, wait for a break below the bearish Pin Bar low before considering bearish follow-through.
12 · XAUUSD · 15 minutes
Or : Étoile filante Rejection and Recovery Chandelles
Ce que montre le graphique : A Étoile filante is marked after an upward push, with a Doji appearing during the earlier range. Long bullish chandelles are marked as prix later recovers from a decline; a long bearish chandelle appears during a pullback.
Psychologie du marché : The Étoile filante's upper wick shows rejection of higher prixs. Later bullish impulse chandelles show acheteurs regaining momentum, while the bearish chandelle highlights that pullbacks can occur inside a recovery.
Confirmation : A bearish close below the Étoile filante low would strengthen the rejection case. For continuation haussière, look for prix to hold a higher low and break the nearest swing high.
13 · XAUUSD · 15 minutes
Or : Haussier Rejection Followed by Upper-Mèche Rejection
Ce que montre le graphique : A Doji appears near the left side, followed by long bullish chandelles and a bullish Pin Bar near a local low. After a strong rally, a Étoile filante and bearish Pin Bar are marked near le plus haut, followed by a decline.
Psychologie du marché : plus baser-wick rejection appears during the recovery, while upper-wick rejection appears after the rally. The sequence shows why the same chandelle family can have different implications depending on where it forms.
Confirmation : Look for a break above a nearby high after the bullish Pin Bar, and a break below the bearish Pin Bar low after the later rejection. Avoid entering before the chandelle closes.
14 · XAUUSD · 15 minutes
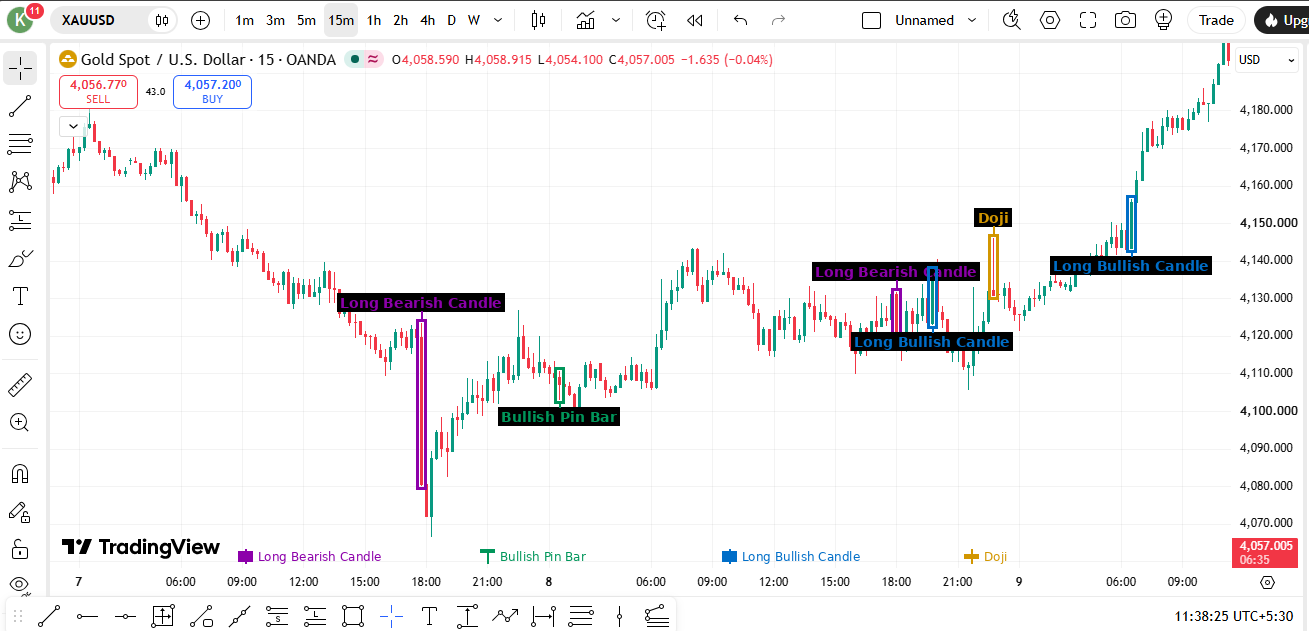
Or : Selling Pressure, Haussier Pin Bar and Trend Recovery
Ce que montre le graphique : A long bearish chandelle appears during a decline. A bullish Pin Bar is marked near le plus baser area, followed by a recovery. A Doji forms during consolidation before long bullish chandelles push prix higher.
Psychologie du marché : The lower-wick rejection suggests vendeurs could not maintain control at le plus bas. The Doji shows a pause during the recovery, and the later bullish chandelles show renewed buying momentum.
Confirmation : A higher low followed by a break above the consolidation high supports continuation haussière. If prix falls below the Pin Bar low, the reversal idea is invalidated.
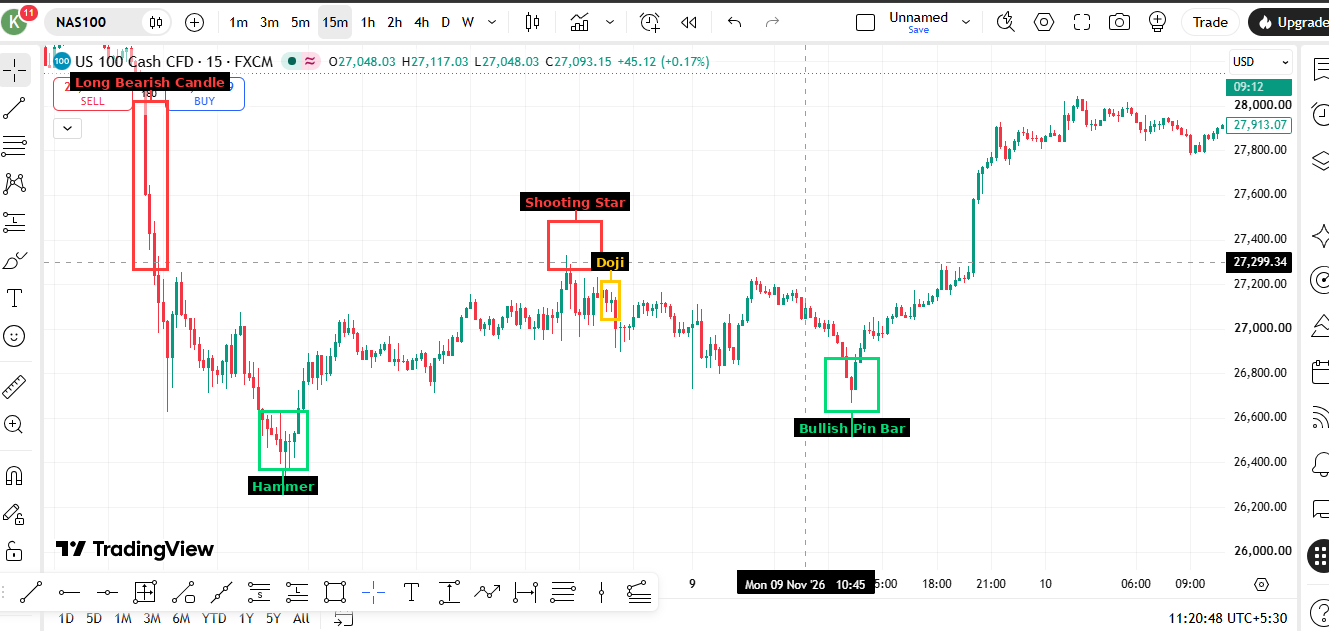
15 · NAS100 · 15 minutes
NAS100 : From Baissier Expansion to Haussier Signaux de retournement
Ce que montre le graphique : A long bearish chandelle marks a sharp drop. A Marteau appears near a later low, while a Étoile filante and Doji are marked around a consolidation area. A bullish Pin Bar appears during the subsequent recovery.
Psychologie du marché : The initial bearish chandelle shows strong selling. The Marteau and bullish Pin Bar show lower prixs being rejected at separate points, while the Étoile filante warns that an upward attempt can also meet selling pressure.
Confirmation : For a bullish reversal, wait for prix to close above a nearby swing high after le plus baser-wick rejection. The Doji and Étoile filante need directional confirmation; neither is a standalone entry signal.
Note de trading : Ces captures sont des exemples pédagogiques, et non des signaux en direct ni des résultats garantis. Une figure est plus pertinente près d’une zone claire de support/résistance ou d’un swing, avec confirmation par les chandelles suivantes et la structure du marché. La gestion du risque et un stop loss défini restent essentiels.
📊 Complet Figure Reference — All 47 Figures
#
Figure Name
Type
Chandelles
Signal
Fiabilité
1
Doji classique
Simple
1
Neutre
⭐⭐
2
Doji libellule
Simple
1
Haussier / selon le contexte
Dépend du contexte
3
Doji pierre tombale
Simple
1
Neutre / selon le contexte
Dépend du contexte
4
Doji à longues jambes
Simple
1
Neutre / selon le contexte
Dépend du contexte
5
Four Prix Doji
Simple
1
Neutre / selon le contexte
Dépend du contexte
6
Marteau
Simple
1
Haussier / selon le contexte
Dépend du contexte
7
Inverted Marteau
Simple
1
Haussier / selon le contexte
Dépend du contexte
8
Pendu
Simple
1
Baissier / selon le contexte
Dépend du contexte
9
Étoile filante
Simple
1
Baissier / selon le contexte
Dépend du contexte
10
Haussier Marubozu
Simple
1
Haussier / selon le contexte
Dépend du contexte
11
Baissier Marubozu
Simple
1
Baissier / selon le contexte
Dépend du contexte
12
Spinning Top (Haussier)
Simple
1
Haussier / selon le contexte
Dépend du contexte
13
Spinning Top (Baissier)
Simple
1
Baissier / selon le contexte
Dépend du contexte
14
Haussier Belt Hold
Simple
1
Haussier / selon le contexte
Dépend du contexte
15
Baissier Belt Hold
Simple
1
Baissier / selon le contexte
Dépend du contexte
16
Haussier Engulfing
Double
2
Haussier / selon le contexte
Dépend du contexte
17
Baissier Engulfing
Double
2
Baissier / selon le contexte
Dépend du contexte
18
Haussier Harami
Double
2
Haussier / selon le contexte
Dépend du contexte
19
Baissier Harami
Double
2
Baissier / selon le contexte
Dépend du contexte
20
Haussier Harami Cross
Double
2
Haussier / selon le contexte
Dépend du contexte
21
Baissier Harami Cross
Double
2
Baissier / selon le contexte
Dépend du contexte
22
Pince basse
Double
2
Haussier / selon le contexte
Dépend du contexte
23
Pince haute
Double
2
Baissier / selon le contexte
Dépend du contexte
24
Ligne pénétrante
Double
2
Haussier / selon le contexte
Dépend du contexte
25
Couverture en nuage noir
Double
2
Baissier / selon le contexte
Dépend du contexte
26
Haussier Kicker
Double
2
Haussier / selon le contexte
Dépend du contexte
27
Baissier Kicker
Double
2
Baissier / selon le contexte
Dépend du contexte
28
Haussier Meeting Lines
Double
2
Haussier / selon le contexte
Dépend du contexte
29
Baissier Meeting Lines
Double
2
Baissier / selon le contexte
Dépend du contexte
30
Étoile du matin
Triple
3
Haussier / selon le contexte
Dépend du contexte
31
Étoile du soir
Triple
3
Baissier / selon le contexte
Dépend du contexte
32
Étoile du matin avec Doji
Triple
3
Haussier / selon le contexte
Dépend du contexte
33
Étoile du soir avec Doji
Triple
3
Baissier / selon le contexte
Dépend du contexte
34
Trois soldats blancs
Triple
3
Haussier / selon le contexte
Dépend du contexte
35
Trois corbeaux noirs
Triple
3
Baissier / selon le contexte
Dépend du contexte
36
Trois chandeliers intérieurs haussiers
Triple
3
Neutre / selon le contexte
Dépend du contexte
37
Trois chandeliers intérieurs baissiers
Triple
3
Neutre / selon le contexte
Dépend du contexte
38
Trois chandeliers extérieurs haussiers
Triple
3
Neutre / selon le contexte
Dépend du contexte
39
Trois chandeliers extérieurs baissiers
Triple
3
Neutre / selon le contexte
Dépend du contexte
40
Haussier Bébé abandonné
Triple
3
Haussier / selon le contexte
Dépend du contexte
41
Baissier Bébé abandonné
Triple
3
Baissier / selon le contexte
Dépend du contexte
42
Three Line Strike (Haussier)
Plusieurs chandelles
4
Haussier / selon le contexte
Dépend du contexte
43
Three Line Strike (Baissier)
Plusieurs chandelles
4
Baissier / selon le contexte
Dépend du contexte
44
Deux corbeaux après un gap haussier
Plusieurs chandelles
4
Baissier / selon le contexte
Dépend du contexte
45
Sandwich
Plusieurs chandelles
4
Haussier / selon le contexte
Dépend du contexte
46
Bloc d’avancée
Plusieurs chandelles
4
Baissier / selon le contexte
Dépend du contexte
47
plus haut Wave Chandelle
Plusieurs chandelles
4
Neutre / selon le contexte
Dépend du contexte
Figure strength is context-dependent, not a fixed statistical rating. Confirm signals with market structure, location, chandelle close and risk management. These examples are educational, not trade recommendations.