Candlestick patterns ki complete guide — har pattern ko professional SVG chart examples, candle ke peeche ki market psychology aur trade setup rules ke saath samjhaya gaya hai. Basics se advanced patterns tak seekhein.
47
Patterns
47
SVG Charts
A-Z
Complete
Pro
Level
📖 Candlesticks itne Important Kyun Hain?
Candlestick charts were invented by Japanese rice trader Homma Munehisa in the 1700s. He discovered that market prices are not just driven by supply and demand — but also by traders ki emotionsse bhi influence hoti hain. Har candle 4 important details dikhati hai:
O
Open
Price kahan se shuru hua
H
High
Sabse upar ka price
L
Low
Sabse neeche ka price
C
Close
Price kahan close hua
🔑 Important Principle: A candlestick pattern is only meaningful when it appears at a important price level (support, resistance, or a major swing point). A Hammer in the middle of nowhere means nothing. A Hammer at a key support = high-probability trade.
🕯️ Candlestick ki Banawat
Every candlestick has 3 partshote hain: Body, Upper Wick (Shadow) aur Lower Wick. Body Open aur Close ke beech ka range dikhati hai. Wicks batati hain ki price kis level tak gaya aur wahan se reject hua.
Green / Bullish Candle
Close, Open se upar hota hai. Is session mein buyers strong rahe.
Red / Bearish Candle
Close, Open se neeche hota hai. Is session mein sellers strong rahe.
Wick (Shadow)
Price us level tak gaya, lekin wahan se reject hua. Long wick strong rejection dikha sakti hai.
📊 Candlestick Anatomy Chart
Single Candlestick Patterns
Neutral / Reversal
Doji Family
A Doji forms when Open ≈ Close. Yeh temporary balance ya indecision dikhata hai, automatic reversal nahi. Iska meaning previous trend, nearby levels aur next price movement par depend karta hai.
1. Standard Doji
Open = Close. Upar aur neeche lagbhag equal wicks hoti hain. Buyers aur sellers mein se koi bhi clear control mein nahi hota.
📍 Signal: Wait for next candle to confirm direction.
2. Dragonfly Doji 🐉
Open = Close = High. Lower wick bahut lambi hoti hai. Buyers ne lower prices ko reject karke price ko wapas upar push kiya.
📍 Entry: BUY above next bullish candle. SL below the Doji low.
3. Gravestone Doji ⚰️
Open = Close = Low. Upper wick lambi hoti hai. Sellers ne higher prices ko reject karke price ko neeche push kiya.
Dono taraf bahut lambi wicks aur chhoti ya na ke barabar body hoti hai. Buyers aur sellers dono ne move ki koshish ki, lekin clear direction nahi bani.
📍 Signal: Major move coming. Watch for breakout.
5. Four Price Doji
Open = High = Low = Close. Ek flat horizontal line banti hai. Yeh bahut rare hai aur low-volume market conditions mein dikh sakta hai.
📍 Signal: Complete market halt. Avoid trading.
Reversal Signals
Hammer Family
Hammer patterns have a chhoti body aur ek side par lambi wick. Yeh kisi price level par rejection dikha sakte hain. Same shape bullish ya bearish ho sakta hai — yeh trend mein pattern ki location par depend karta hai.
6. Hammer 🔨
Small body at top. Long lower wick = 2x or 3x the body size. Buyers pushed price back up from a low. Found at the downtrend ke bottom par.
📍 Entry: BUY above next green candle. SL = below hammer low.
7. Inverted Hammer
Small body at bottom. Long upper wick. Buyers tried to push higher. Appears at bottom of downtrend. Weaker than Hammer — needs confirmation.
📍 Entry: Wait for next green candle to confirm before buying.
8. Hanging Man 🪝
Same shape as Hammer but appears at uptrend ke top par. Sellers ne lower prices test kiye. Yeh weakness ka signal ho sakta hai, lekin reversal confirm hona zaroori hai.
📍 Entry: SELL below next red candle. SL above Hanging Man high.
9. Shooting Star ⭐
Small body at bottom. Long upper wick = 2x+ body. At uptrend ke top par. Sellers ne higher prices ko reject kiya. Possible bearish signal ko location, trend context aur follow-through se confirm karein.
📍 Entry: SELL on next red candle. SL above Shooting Star high.
Momentum
Marubozu
Japanese mein Marubozu ka matlab "bald" hota hai — no wicks at all. This is a strong momentum candle in which one side controlled most or all of the candle range. It does not guarantee continuation.
10. Bullish Marubozu
Wicks nahi hoti. Low par open aur High par close hoti hai. Buyers ka strong control dikhati hai, lekin price aur upar jayega yeh guaranteed nahi.
Candle ki body possible Support area ban sakti hai. Pullback par price reaction observe karein.
11. Bearish Marubozu
Wicks nahi hoti. High par open aur Low par close hoti hai. Sellers ka strong control dikhati hai, lekin price aur neeche jayega yeh guaranteed nahi.
Candle ki body possible Resistance area ban sakti hai. Rally par price reaction observe karein.
Indecision & Momentum
Spinning Top & Belt Hold
12. Spinning Top (Bullish)
Chhoti body aur dono taraf wicks hoti hain. Buyers aur sellers dono active hote hain, lekin koi clear control mein nahi hota.
Support par possible bullish reaction ho sakta hai.
13. Spinning Top (Bearish)
Bullish version jaisa hi hota hai, lekin body red hoti hai. Resistance par possible bearish reaction dikha sakta hai.
Resistance par possible bearish reaction ho sakta hai.
14. Bullish Belt Hold
Session ke Low par open hoti hai (lower wick nahi) aur High ke paas close hoti hai. Strong bullish candle jisme buyers shuru se active rahe.
📍 Bullish signal. Next candle ki confirmation ke baad BUY consider karein.
15. Bearish Belt Hold
Session ke High par open hoti hai (upper wick nahi) aur Low ke paas close hoti hai. Strong bearish candle jisme sellers shuru se active rahe.
📍 Bearish signal. Next candle ki confirmation ke baad SELL consider karein.
Double Candlestick Patterns
Strong Reversal
Engulfing Patterns
One of the widely-used reversal patterns. The second candle completely engulfs (covers) the entire body of the first candle — showing a complete shift in who is in control.
16. Bullish Engulfing 🟢
Downtrend ke bottom par green candle ki body previous red candle ki body ko poori tarah cover karti hai. Possible bullish reversal ke liye confirmation aur surrounding market structure check karein.
✅ Entry: Green candle close hone ke baad BUY consider karein
Uptrend ke top par red candle ki body previous green candle ki body ko poori tarah cover karti hai. Possible bearish reversal ke liye confirmation aur market structure check karein.
✅ Entry: Red candle close hone ke baad SELL consider karein
🛑 SL: Pattern ke High ke upar
🎯 TP: Next Support area; trade tabhi consider karein jab planned risk-to-reward suitable ho.
Reversal (Needs Confirmation)
Harami Patterns
Japanese mein "Harami" ka matlab pregnant hota hai. Pehli candle badi hoti hai aur doosri chhoti candle pehli candle ki body ke andar hoti hai. Yeh momentum slow hone ka signal de sakti hai, lekin confirmation zaroori hai.
18. Bullish Harami
Pehle badi red candle, phir uske andar chhoti green candle. Bearish momentum slow ho sakta hai. Support par possible bottom; next candle se confirmation lein.
Third green candle ki confirmation ke baad BUY consider karein.
19. Bearish Harami
Pehle badi green candle, phir uske andar chhoti red candle. Bullish momentum slow ho sakta hai. Resistance par possible top; next candle se confirmation lein.
Third red candle ki confirmation ke baad SELL consider karein.
20. Bullish Harami Cross
Bullish Harami jaisa hi pattern hai, lekin second candle Doji hoti hai. Strong selling ke baad Doji indecision dikhati hai.
Stronger bullish reversal than regular Harami.
21. Bearish Harami Cross
Bearish Harami jaisa hi pattern hai, lekin second candle Doji hoti hai. Strong buying ke baad Doji indecision dikhati hai.
Stronger bearish reversal than regular Harami.
Precision Reversal
Tweezer Patterns
Do candles lagbhag same High (Tweezer Top) ya same Low (Tweezer Bottom) banati hain. Price ne similar area ko ek se zyada baar test kiya. Yeh rejection dikha sakta hai, institutional activity ka proof nahi.
22. Tweezer Bottom 📌
Both candles reach the same low. Price tested that level twice and was rejected. Strong buyers at that exact price. Second candle ke High ke upar BUY consider karein. SL dono Lows ke neeche rakhein.
23. Tweezer Top 📌
Both candles reach the same high. Price tried to break higher twice but was rejected. Strong sellers defending that level. Second candle ke Low ke neeche SELL consider karein. SL dono Highs ke upar rakhein.
Moderate Reversal
Piercing Line & Dark Cloud Cover
24. Piercing Line
Large red candle. Then green candle opens BELOW the red's low but closes ABOVE 50% of the red body. Buyers fighting back. Confirmation ke baad BUY consider karein.
25. Dark Cloud Cover
Large green candle. Then red candle opens ABOVE the green's high but closes BELOW 50% of the green body. Sellers fighting back. Confirmation ke baad SELL consider karein.
Most Powerful 2-Candle
Kicker Patterns
Kicker ek gap-based two-candle pattern hai jisme second candle opposite direction mein sharply open hoti hai. Yeh market sentiment mein sudden change dikha sakta hai, aksar news ke aas-paas. Spot Forex mein actual gaps uncommon hote hain aur retest ho sakte hain.
26. Bullish Kicker 🚀
Red candle ke baad price gap UP karke bullish (green) candle ke roop mein open hota hai. Gap retest ho sakta hai. News ke aas-paas aisa move dikh sakta hai.
27. Bearish Kicker 📉
Green candle ke baad price gap DOWN karke bearish (red) candle ke roop mein open hota hai. Gap retest ho sakta hai; sirf pattern ke basis par trade na lein.
Reversal
Meeting Lines (Counterattack)
Two candles where the second candle, first candle ke lagbhag same price par close hoti hai. Pehli badi candle ke opposite colour ki second candle wapas aakar usi level par close hoti hai.
28. Bullish Meeting Lines
Badi red candle ke baad green candle neeche open hoti hai, lekin red candle ke same close level par close hoti hai. Buyers selling pressure absorb kar rahe ho sakte hain.
29. Bearish Meeting Lines
Badi green candle ke baad red candle upar open hoti hai, lekin green candle ke same close level par close hoti hai. Sellers buying pressure absorb kar rahe ho sakte hain.
Triple Candlestick Patterns
Potential Reversal
Star Patterns
Star patterns are 3-candle formations and among the important reversal signals mein se ek in all of technical analysis. Widely trusted by institutional traders globally.
30. Morning Star ⭐ (Bullish)
1
Badi bearish candle — sellers ka strong control
2
Chhoti candle (star) — indecision, sellers ka pressure kam ho sakta hai
3
Badi bullish candle jo first candle ke midpoint ke upar close hoti hai
✅ Entry: BUY on close of candle 3 🛑 SL: Below candle 2 low 🎯 TP: Next meaningful resistance; check whether the planned risk-to-reward is acceptable.
31. Evening Star 🌙 (Bearish)
1
Badi bullish candle — buyers ka strong control
2
Top par chhoti candle — indecision, buyers ka pressure kam ho sakta hai
3
Badi bearish candle jo first candle ke midpoint ke neeche close hoti hai
✅ Entry: SELL on close of candle 3 🛑 SL: Above candle 2 high 🎯 TP: Next meaningful support; check whether the planned risk-to-reward is acceptable.
32. Morning Doji Star ⭐ (Stronger)
Same as Morning Star but the middle candle is a Doji (perfect indecision). The reversal signal is significantly stronger because the Doji shows sellers completely lost control before buyers took over.
Stronger than regular Morning Star. Enter BUY on candle 3 close.
33. Evening Doji Star 🌙 (Stronger)
Same as Evening Star but the middle candle is a Doji (perfect indecision). Much stronger bearish reversal because the Doji shows buyers completely lost control before sellers took over.
Stronger than regular Evening Star. Enter SELL on candle 3 close.
Trend Continuation
Three Soldiers & Three Crows
34. Three White Soldiers 🏹
3 consecutive large green candles, each closing higher than the previous and each opening within the prior body. Strong uptrend continuation. Price ko chase na karein — pullback aur confirmation ka wait karein.
35. Three Black Crows 🦅
3 consecutive large red candles, each closing lower. Strong downtrend signal. Appears after a top or during a breakdown. Rally ke dauran price reaction observe karein aur bearish momentum confirm karein.
Confirmed Reversal
Three Inside & Three Outside
These are Harami and Engulfing patterns jinko third candle confirmation deti hai. Third candle confirmation deti hai, lekin market context zaroor check karein.
36. Three Inside Up
Red → andar chhoti Green → badi Green jo upar break karti hai. Possible bullish reversal; third candle close par confirmation check karein.
37. Three Inside Down
Green → andar chhoti Red → badi Red jo neeche break karti hai. Possible bearish reversal; third candle close par confirmation check karein.
38. Three Outside Up
Bullish Engulfing (2 candles) then a 3rd candle that closes even higher = confirmed uptrend reversal. Most reliable of the three-candle bullish patterns.
Engulfing + confirmation = a possible BUY setup, not a guarantee.
39. Three Outside Down
Bearish Engulfing (2 candles) then a 3rd candle that closes even lower = confirmed downtrend reversal. Most reliable of the three-candle bearish patterns.
Engulfing + confirmation = a possible SELL setup, not a guarantee.
Rare & Extremely Powerful
Abandoned Baby
An Abandoned Baby is a rare three-candle reversal formation in which a Doji is separated from the surrounding candles by gaps on both sides. Gaps are uncommon in spot forex, so textbook examples are less frequent. Wait for confirmation; no pattern is guaranteed.
40. Bullish Abandoned Baby 👶
Large red candle → gap down → isolated Doji → gap up → large green candle. Both gaps show the Doji is completely isolated. Extremely strong buy signal.
✅ Entry: BUY on close of green candle 🛑 SL: Below the Doji low 🎯 Min R:R: 1:4
41. Bearish Abandoned Baby 👶
Large green candle → gap up → isolated Doji → gap down → large red candle. Both gaps show the Doji is completely isolated. Extremely strong sell signal.
✅ Entry: SELL on close of red candle 🛑 SL: Above the Doji high 🎯 Min R:R: 1:4
Rare & Advanced Patterns
Advanced
Rare & Advanced Patterns
These patterns are less common but appear in real markets. Knowing them gives you a significant edge over traders who only know the basics. Most traders have never heard of these.
42. Three Line Strike (Bullish)
3 consecutive red candles followed by 1 large green candle that engulfs all 3. Counter-intuitive: this is actually a bullish continuation. Bears exhausted, bulls take over.
Potential BUY setup after the fourth bullish candle closes; wait for confirmation and a suitable entry location.
43. Three Line Strike (Bearish)
Three consecutive bullish candles are followed by a large bearish candle that reverses the preceding advance. This is the bearish counterpart to the bullish setup; the pattern alone does not prove institutional activity.
Potential SELL setup after the 4th bearish candle closes; wait for confirmation and a suitable entry location.
44. Upside Gap Two Crows
Large green candle, then 2 small red candles that gap up but stay above the green candle. Bearish reversal forming at the top. The gap is the warning sign — sellers appearing despite high prices.
Bearish reversal. Watch for breakdown below the gap.
45. Stick Sandwich
Red candle, then green candle, then red candle with the SAME closing price as the first red candle. The green is sandwiched. A bullish reversal signal — sellers tried twice at the same level and couldn't break lower.
Bullish reversal. Double-bottom forming at same close price.
46. Advance Block
Three green candles like White Soldiers but each has progressively smaller bodies and longer upper wicks. Shows buyers are weakening and losing momentum. Bearish reversal warning — uptrend about to stall.
Warning sign at resistance. Reduce longs, watch for reversal.
47. High Wave Candle
Small body with extremely long wicks on BOTH sides. Huge volatility with no clear direction. Price traveled far up AND down but closed near the open. Market is in maximum confusion.
Avoid trading. Wait for clarity. Major move incoming.
⚡ Entry Module
How to Trade Candlestick Patterns
A pattern alone means nothing. It's the Location + Pattern + Confirmation that creates a high-probability trade. Use this 3-step system for every trade:
1
Location
Is the pattern forming at a key support, resistance, or major swing level? A pattern at a meaningful support/resistance area or swing point is generally more useful than the same shape in the middle of a range.
2
Pattern
Is there a valid candlestick pattern? Must show clear rejection ya reversal at the key level. The candle must be complete — never enter on an unfinished candle.
3
Confirmation
Wait for the ki next candle direction confirm kare the direction. Enter on close of confirmation candle. Never FOMO — if you miss it, the market will give you another setup.
📋 Sabhi Patterns ki Entry Guide
Pattern
Signal
Entry Trigger
Stop Loss
Min R:R
Dragonfly Doji
🟢 BUY
Above next green candle
Below Doji low
1:2
Gravestone Doji
🔴 SELL
Below next red candle
Above Doji high
1:2
Hammer
🟢 BUY
Above next green candle
Below Hammer low
1:2
Shooting Star
🔴 SELL
Below next red candle
Above Star high
1:2
Hanging Man
🔴 SELL
Below next red candle
Above Hanging Man high
1:2
Bullish Marubozu
🟢 BUY
On pullback to body
Below Marubozu low
1:2
Bearish Marubozu
🔴 SELL
On rally to body
Above Marubozu high
1:2
Bullish Engulfing
🟢 BUY
On close of green candle
Below pattern low
1:2
Bearish Engulfing
🔴 SELL
On close of red candle
Above pattern high
1:2
Tweezer Bottom
🟢 BUY
Above 2nd candle close
Below twin lows
1:2
Tweezer Top
🔴 SELL
Below 2nd candle close
Above twin highs
1:2
Bullish Kicker
🟢 BUY
On close of green candle
Below the gap
1:3
Bearish Kicker
🔴 SELL
On close of red candle
Above the gap
1:3
Morning Star
🟢 BUY
On close of candle 3
Below candle 2 low
1:3
Evening Star
🔴 SELL
On close of candle 3
Above candle 2 high
1:3
Three White Soldiers
🟢 BUY
Buy pullback after 3rd candle
Below recent swing low
1:2
Three Black Crows
🔴 SELL
Sell rally after 3rd candle
Above recent swing high
1:2
Abandoned Baby (Bull)
🟢 BUY
On close of green candle
Below the Doji low
1:4
Abandoned Baby (Bear)
🔴 SELL
On close of red candle
Above the Doji high
1:4
Three Line Strike (Bull)
🟢 BUY
After 4th bullish candle closes
Below 4th candle low
1:3
❌ Ye Galtiyan Na Karein
✖
Candle close hone se pehle entry na lein; pattern complete hona chahiye.
✖
Nearby important price level ke bina pattern par trade na karein.
✖
Higher timeframe ke trend ke against trade karne se bachein.
✖
Har pattern par trade na lein; sirf clear setups choose karein.
✖
Stop Loss ke bina kabhi trade na karein.
✖
Ek trade mein account ka 1–2% se zyada risk lene se bachein.
Price ke level tak pahunchne se pehle important levels mark karein.
✔
Trade entry se pehle candle close hone ka wait karein.
✔
London aur New York session ke current timings check karein; daylight-saving changes ka dhyan rakhein aur apni strategy ke suitable hours par focus karein.
✔
Trading journal maintain karein aur har trade review karein.
✔
Higher timeframe candles ko context ke saath zyada importance dein.
Real chart examples
Real Chart Examples — NAS100, XAUUSD aur US30
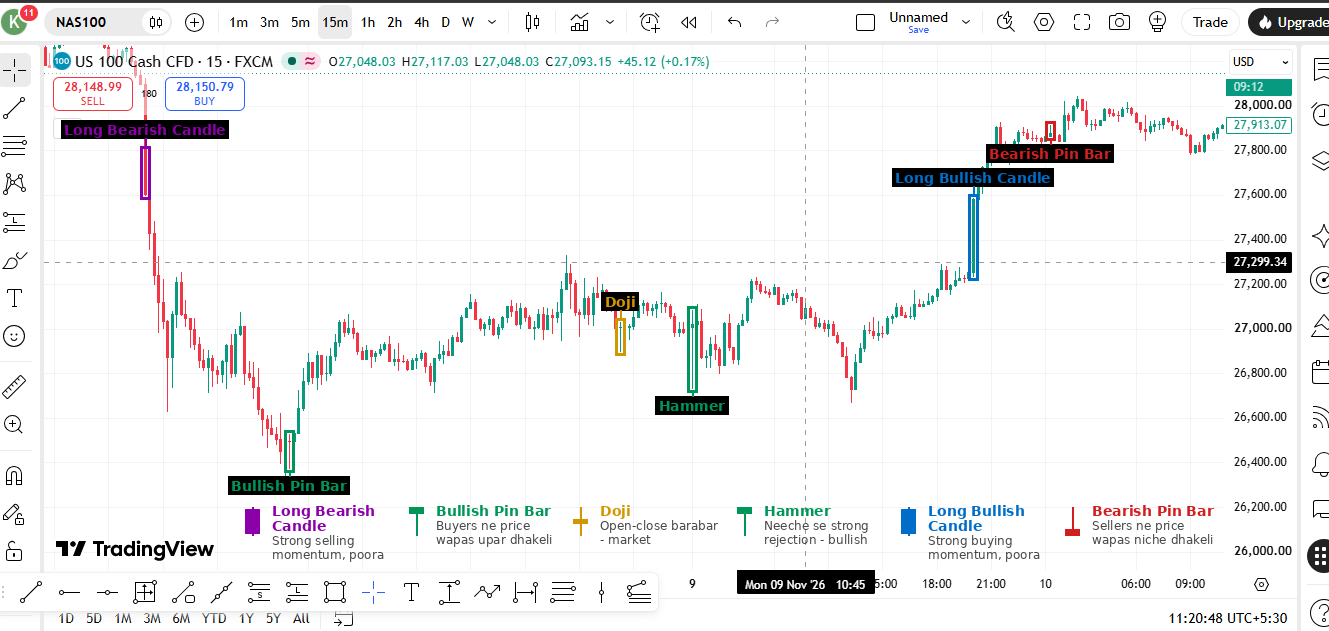
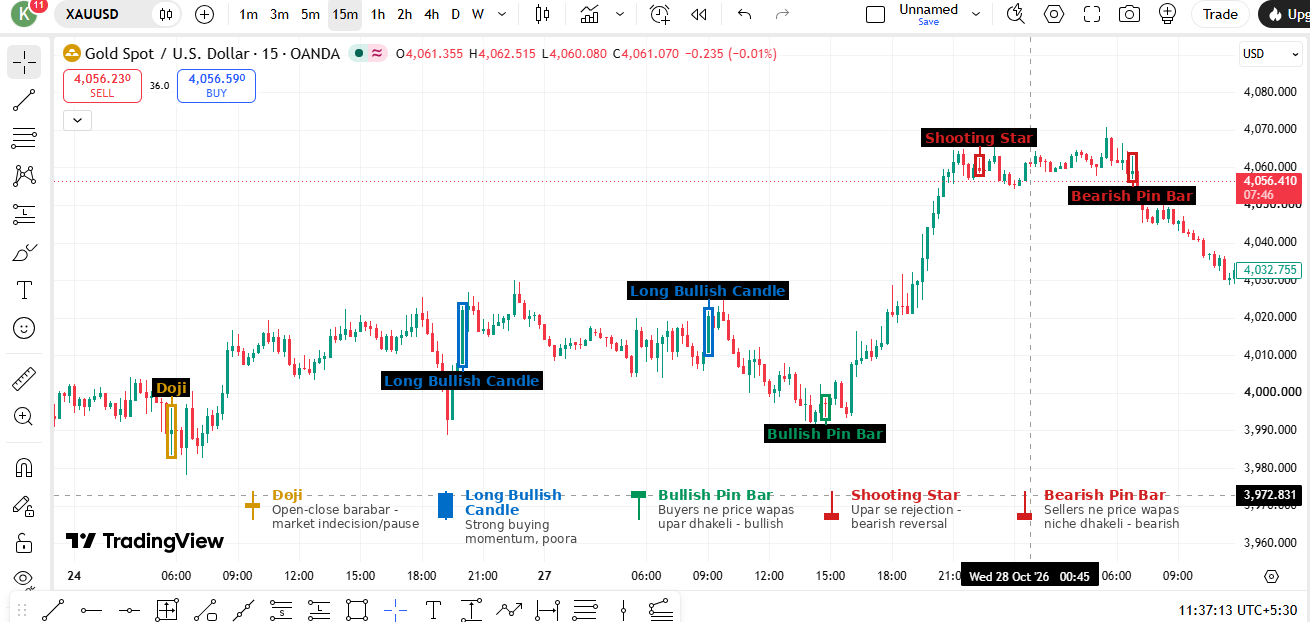
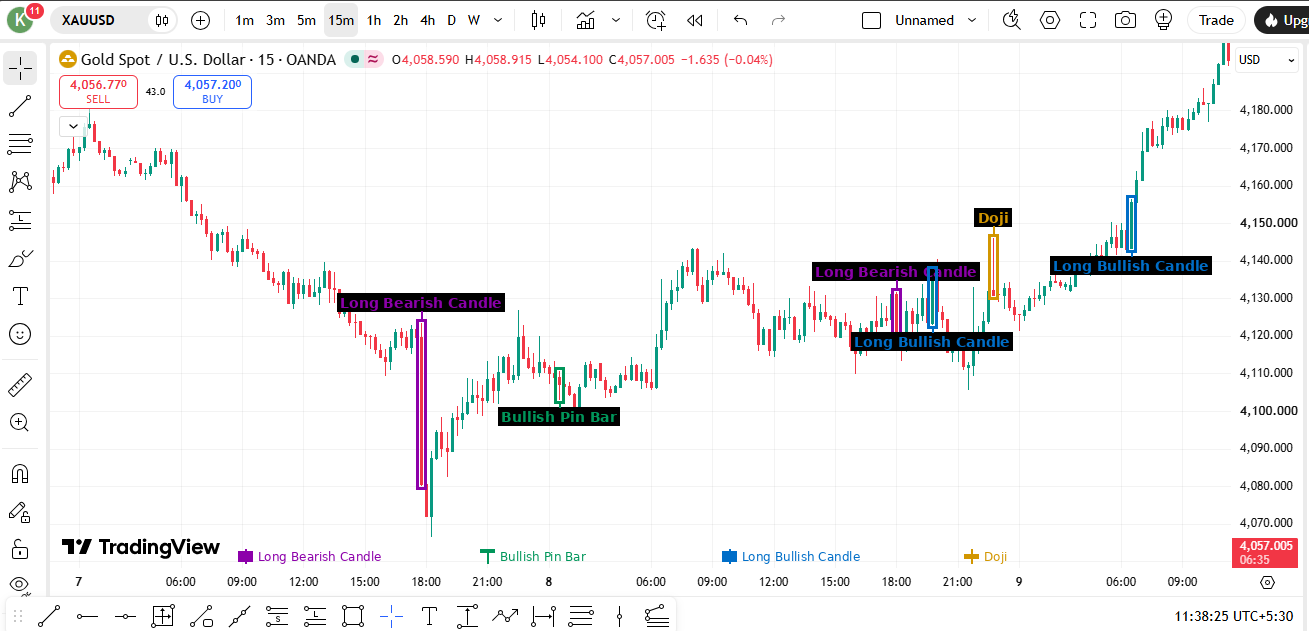
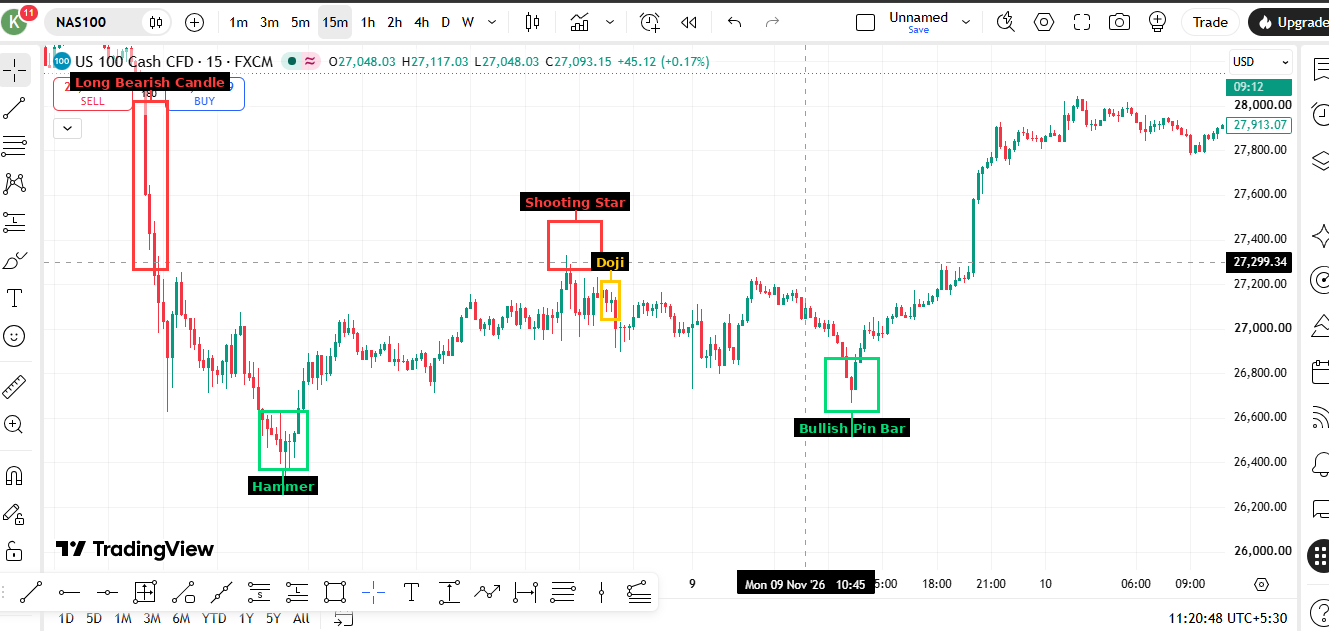
Real market movement mein candlestick behaviour kaise dikhta hai, yeh study karein. Annotated TradingView examples mein long bullish aur bearish candles, Doji, Hammer, bullish aur bearish Pin Bars, aur Shooting Stars dikhaye gaye hain. Sirf marked candle nahi, uske aas-paas ka price action bhi read karein — context se candle pattern useful banta hai.
01 · NAS100 · 15-minute
Reading Rejection and Momentum in One Session
Chart mein kya dikh raha hai: A strong bearish candle drives price lower, while a bullish Pin Bar and a Hammer later show rejection from lower prices. A Doji marks a pause, followed by a long bullish candle and a bearish Pin Bar near the later high.
Isse kaise samjhein: The lower-wick rejections suggest buyers are defending an area, but the Doji alone is indecision—not a buy signal. The long bullish candle shows stronger buying participation; the later bearish Pin Bar warns that buyers may be meeting supply.
Confirmation: Look for a close above the rejection candle high for bullish follow-through, or a break below the bearish Pin Bar low for bearish follow-through. Always check the nearby swing levels.
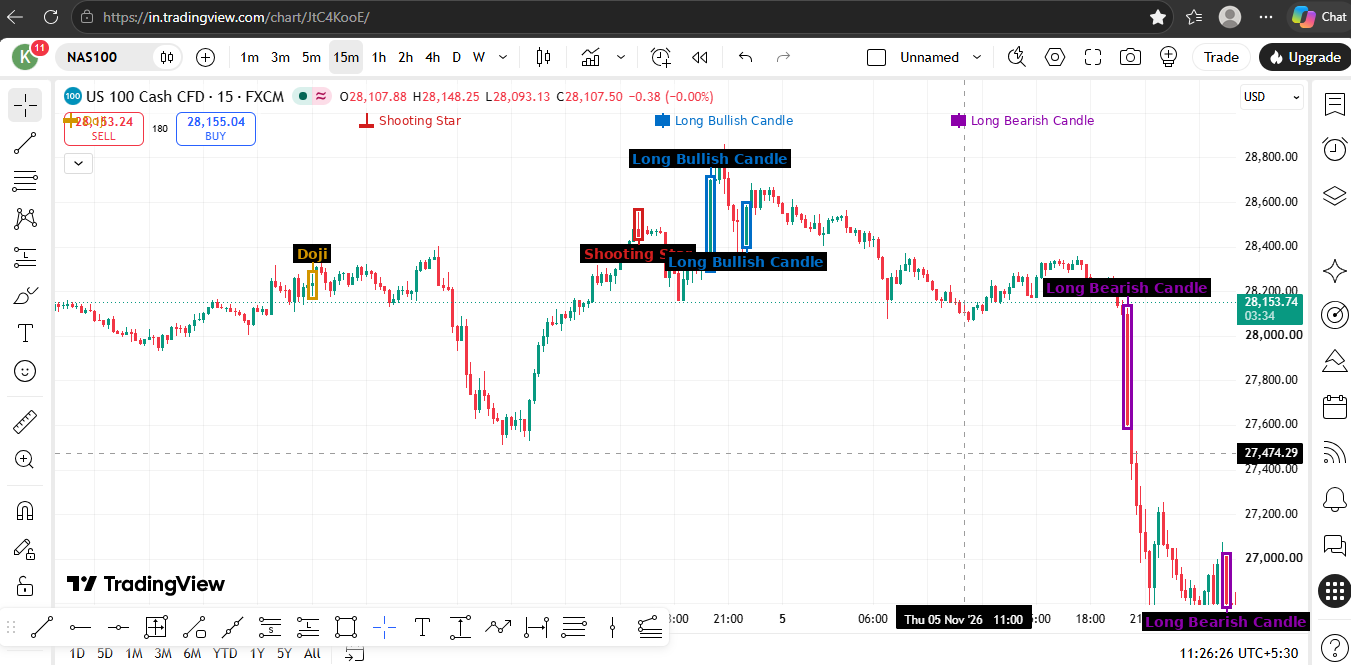
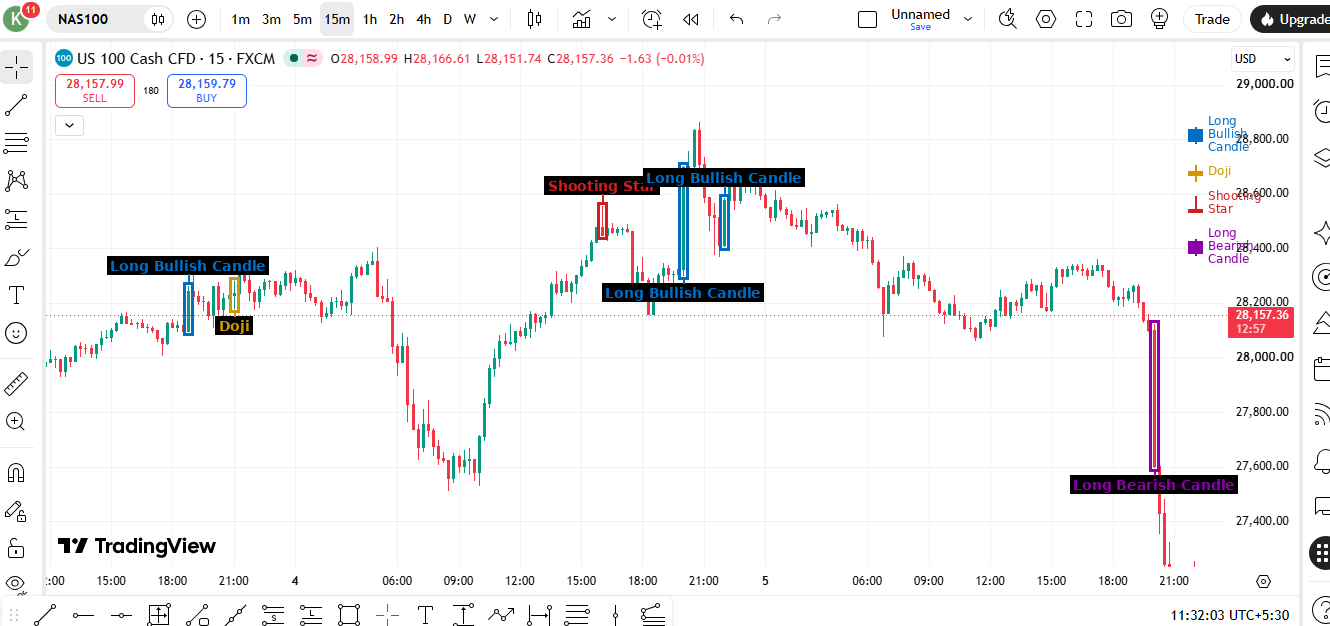
02 · NAS100 · 15-minute
Doji, Shooting Star and Strong Candle Expansion
Chart mein kya dikh raha hai: A Doji appears during a sideways phase, a Shooting Star is marked after an upward push, and long bullish candles appear during the recovery. Long bearish candles later accompany a sharp sell-off.
Market Psychology: The Doji reflects a temporary balance between buyers and sellers. The Shooting Star shows an attempt to trade higher that was rejected. Large candle bodies show decisive momentum, but do not by themselves prove that a trend will continue.
Confirmation: For a Shooting Star, watch for a bearish close or a break of its low. For bullish continuation, look for price to hold above the impulse candle's base and form a higher low.
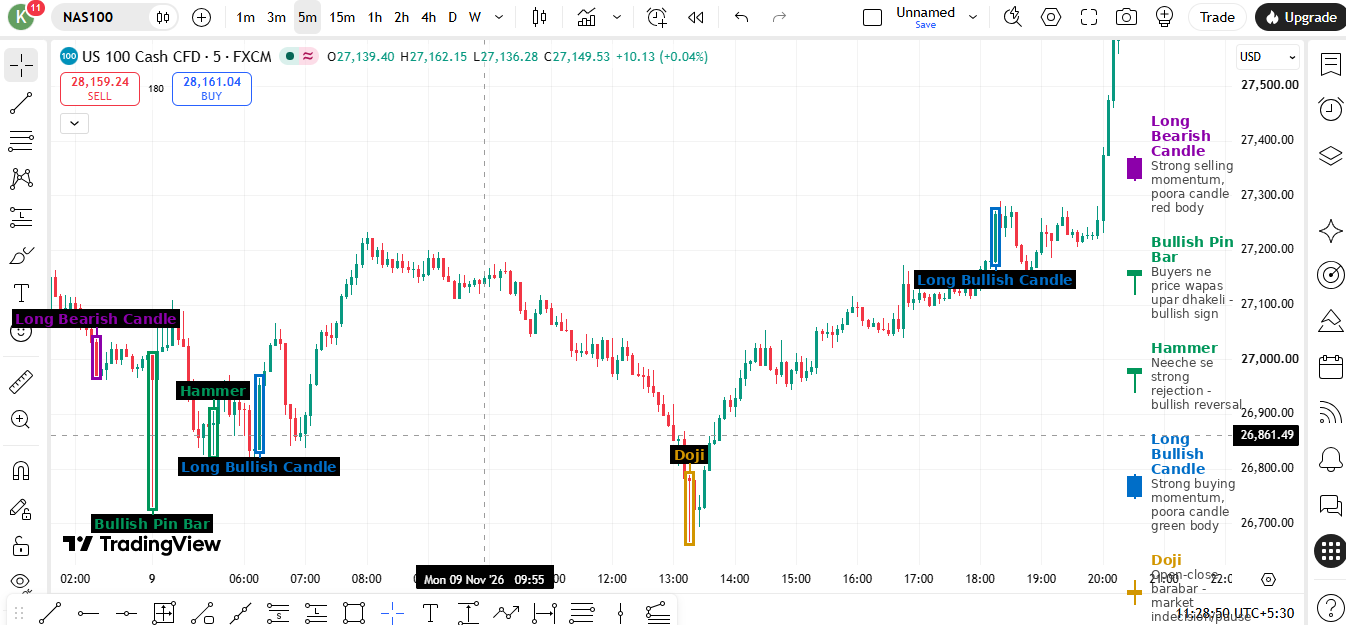
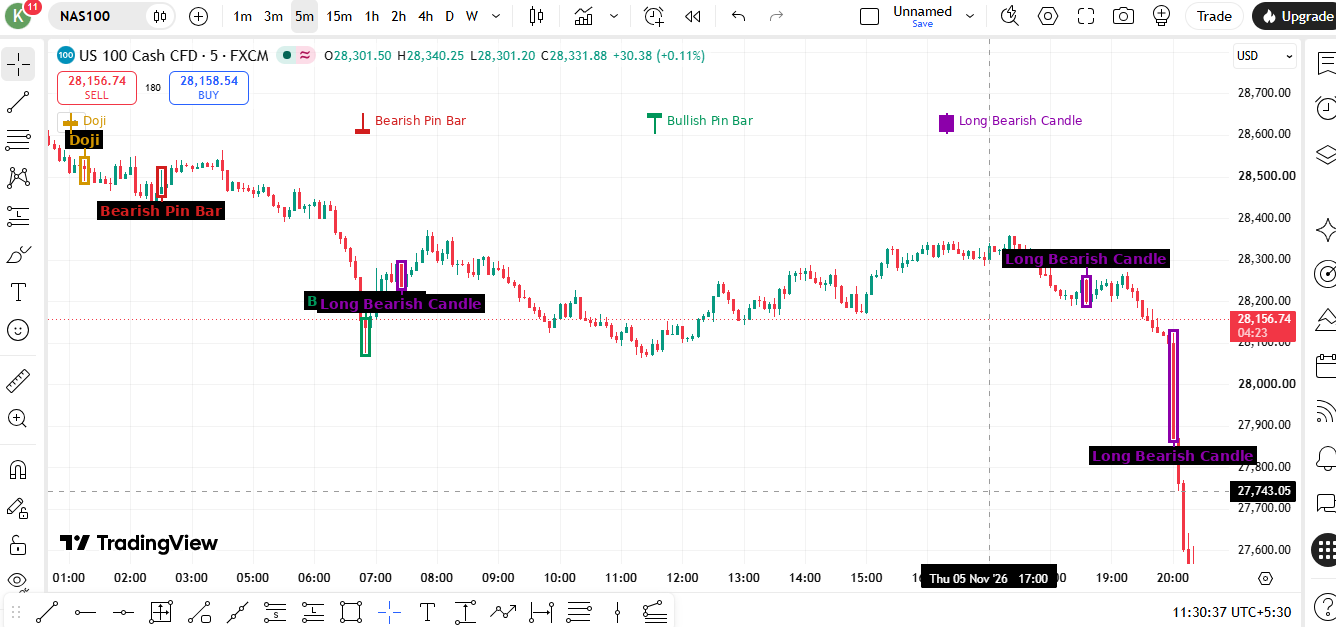
03 · NAS100 · 5-minute
Hammer and Bullish Pin Bar During a Recovery
Chart mein kya dikh raha hai: A Hammer and a bullish Pin Bar are marked after downward movement, with a Doji appearing near a later intraday low. Long bullish candles then appear as price advances.
Market Psychology: The long lower shadows show that sellers pushed price down but could not keep it there. The following bullish expansion suggests buyers gained control after the rejection.
Confirmation: A close above the Hammer or Pin Bar high adds evidence of a reversal. A retest that holds the rejection area can offer a more controlled entry than chasing the first large green candle.
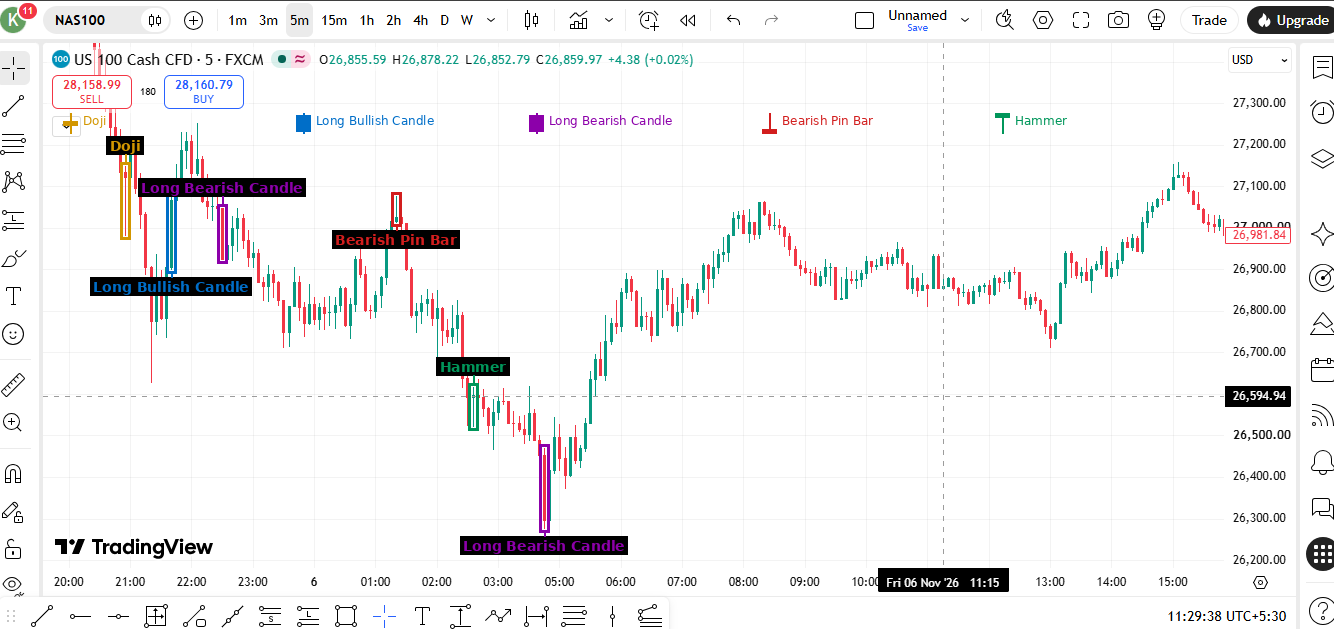
04 · NAS100 · 5-minute
Bearish Pressure, Hammer Rejection and Recovery
Chart mein kya dikh raha hai: Several long bearish candles appear during the decline. A Hammer is marked near the low, followed by a strong upward reaction. A bearish Pin Bar is also marked earlier near a local high.
Market Psychology: The bearish candles show strong selling pressure. Near the low, the Hammer indicates that lower prices were rejected; the rebound shows buyers responding, although the pattern needs confirmation.
Confirmation: Watch whether price closes above the Hammer high and breaks the nearest lower high. If price instead breaks the Hammer low, the bullish-reversal idea is invalidated.
05 · NAS100 · 5-minute
Pin Bar Rejections Inside a Bearish Move
Chart mein kya dikh raha hai: A Doji and bearish Pin Bar appear near the early part of the chart. A bullish Pin Bar is marked during a later recovery, while long bearish candles appear near the right side before price drops sharply.
Iska interpretation kaise karein: A bullish Pin Bar can create a short-term bounce without reversing the broader structure. The later bearish expansion is a reminder to distinguish a local reaction from a confirmed trend change.
Confirmation: Compare each rejection with the latest swing high and low. A bullish idea needs a higher high or a clear bullish break; a bearish idea gains support if price breaks the rejection candle low.
06 · NAS100 · 15-minute
Momentum Candles and a Shooting Star at the High
Chart mein kya dikh raha hai: Long bullish candles appear during an upward leg. A Doji signals a pause, a Shooting Star is marked close to the local high, and a long bearish candle appears later as price sells off.
Market Psychology: Buyers initially move price higher with strong bodies. The Shooting Star shows rejection of higher prices, while the later bearish expansion confirms that sellers were able to push price lower in this example.
Confirmation: Do not sell simply because a Shooting Star appears. Wait for a bearish close or a break below its low, ideally with resistance or a prior high nearby.
07 · NAS100 · 15-minute
Multiple Rejections Around Intraday Swing Points
Chart mein kya dikh raha hai: A Doji and bullish Pin Bar appear during the earlier decline. A long bullish candle marks a forceful upward move. A bearish Pin Bar near the later high is followed by a sell-off, and a bullish Pin Bar and Hammer appear near the low.
Market Psychology: The chart demonstrates that rejection candles can appear on both sides of the market. Their meaning depends on location: the bearish rejection near a high precedes weakness, while lower-wick rejections near the low precede a recovery.
Confirmation: Use the nearby swing structure. A bullish setup should reclaim a short-term high; a bearish setup should break a recent low. Avoid treating every wick as an automatic reversal.
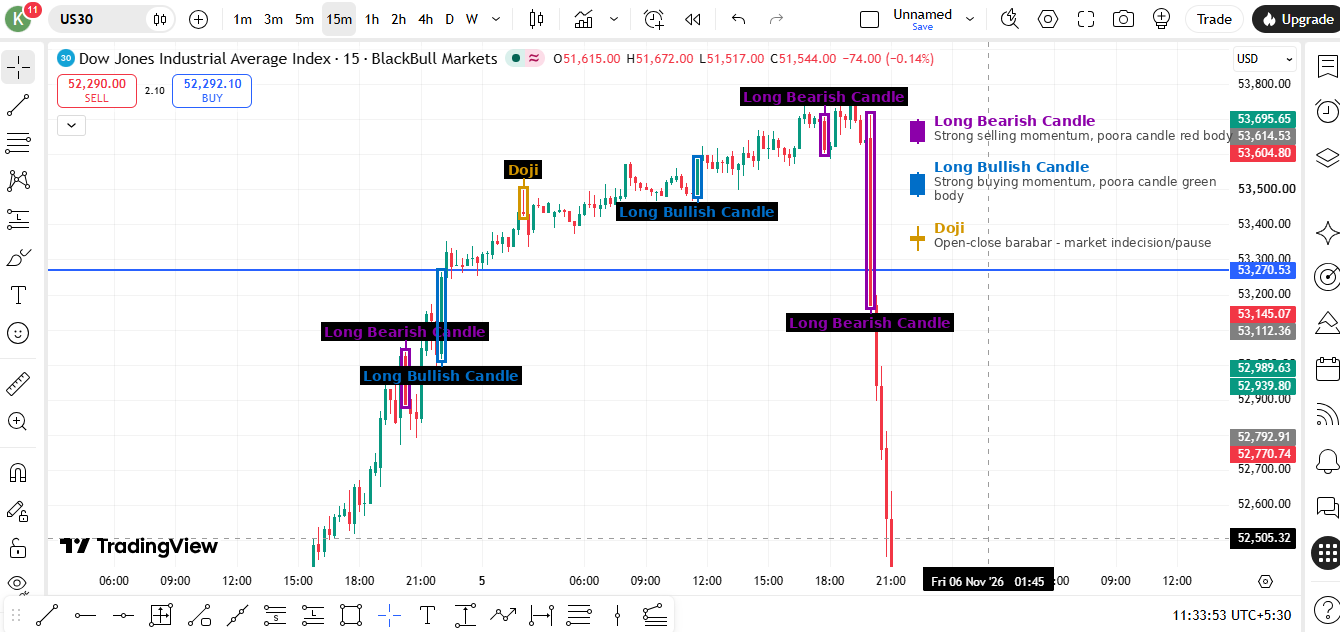
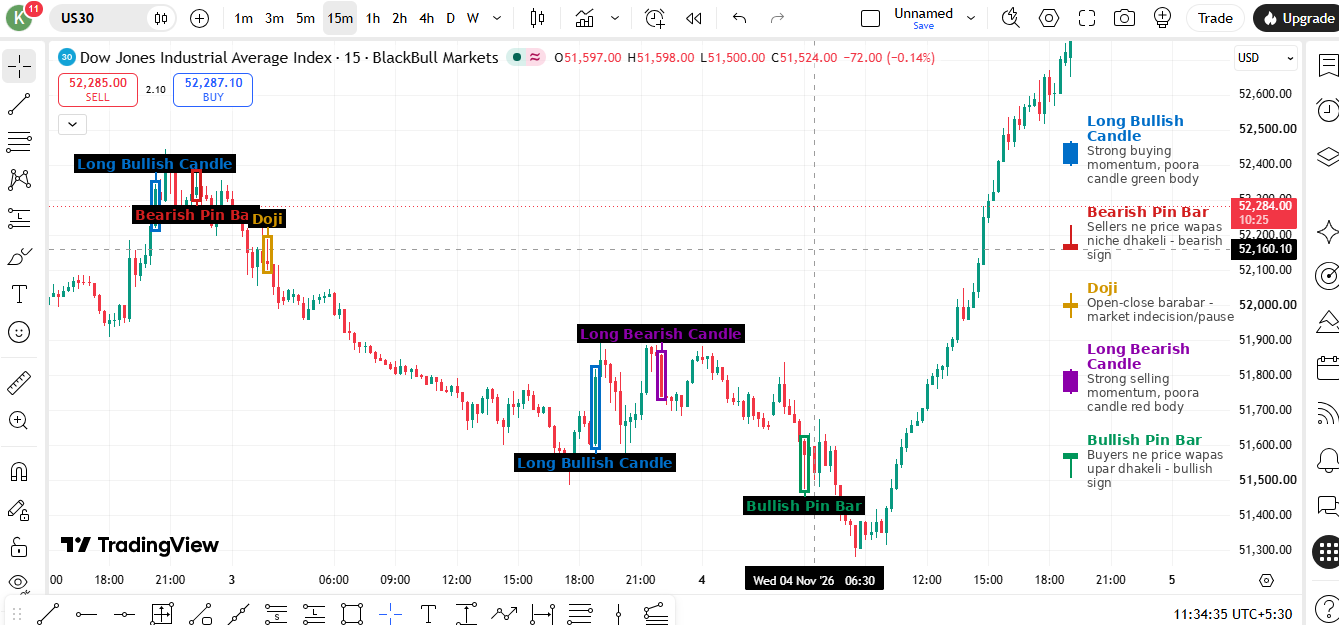
08 · US30 · 15-minute
Momentum Expansion and a Sharp Bearish Reversal
Chart mein kya dikh raha hai: Long bullish candles appear as US30 advances through the marked level. A Doji forms near the upper part of the move, followed by long bearish candles and a sharp decline.
Market Psychology: The bullish impulse reflects strong buying. The Doji indicates hesitation after the advance, but the subsequent bearish expansion—not the Doji alone—is what demonstrates that sellers took control in this sample.
Confirmation: Watch for a break of the Doji's local support or a lower high after the pause. A Doji can also precede continuation, so wait for price to reveal direction.
09 · US30 · 15-minute
Bearish Pin Bar, Doji and Bullish Rejection
Chart mein kya dikh raha hai: A bearish Pin Bar and Doji are marked after an early rise. Long bearish candles accompany the decline, while a bullish Pin Bar appears close to the low before a strong recovery and long bullish candles.
Market Psychology: The upper-wick rejection suggests buyers could not hold the higher prices. Near the low, the bullish Pin Bar shows lower prices being rejected; the subsequent rally provides follow-through in this example.
Confirmation: For a bullish reversal, look for price to break a nearby lower high after the Pin Bar. For bearish continuation, a fresh low and failed retest would support the sellers' case.
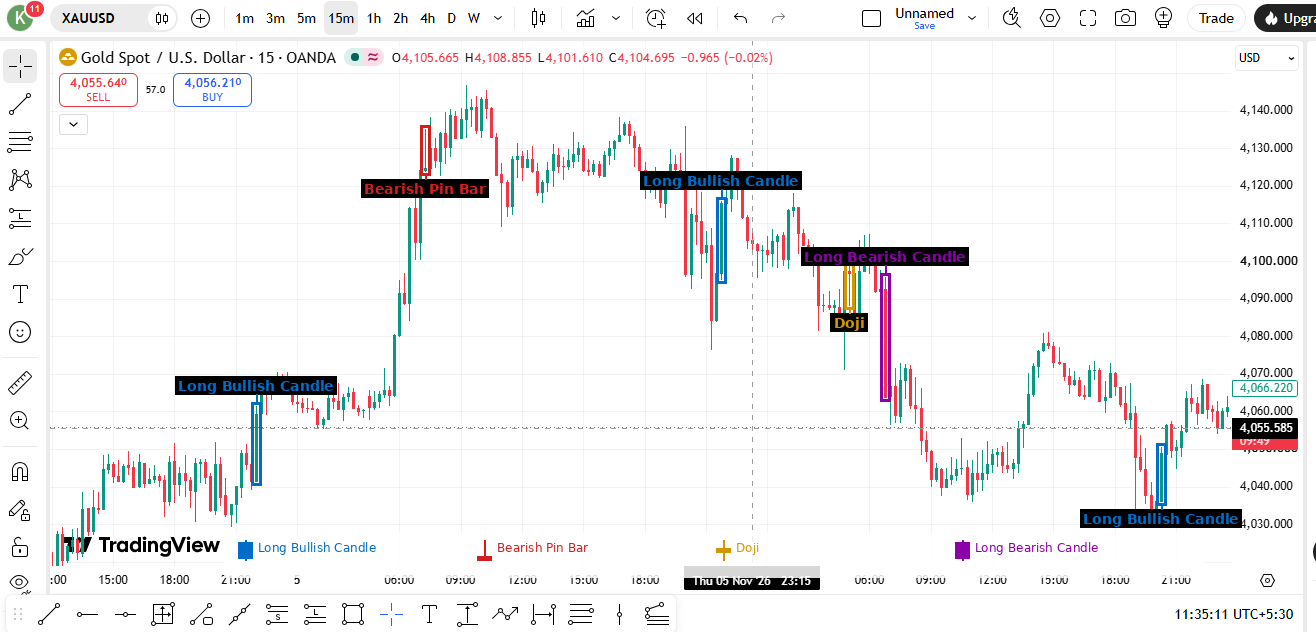
10 · XAUUSD · 15-minute
Gold: Bullish Impulse Followed by Bearish Rejection
Chart mein kya dikh raha hai: A long bullish candle appears during an upward push. A bearish Pin Bar is marked near the high, followed by long bearish candles and a Doji during the decline. Another long bullish candle appears near the later low.
Market Psychology: The chart captures a shift from buying momentum to rejection at higher prices. The Doji during the decline is a pause, while the later bullish candle shows a forceful response from lower levels.
Confirmation: At the high, look for a close below the bearish Pin Bar low. Near the low, wait for a bullish close and a structure break before assuming the decline has reversed.
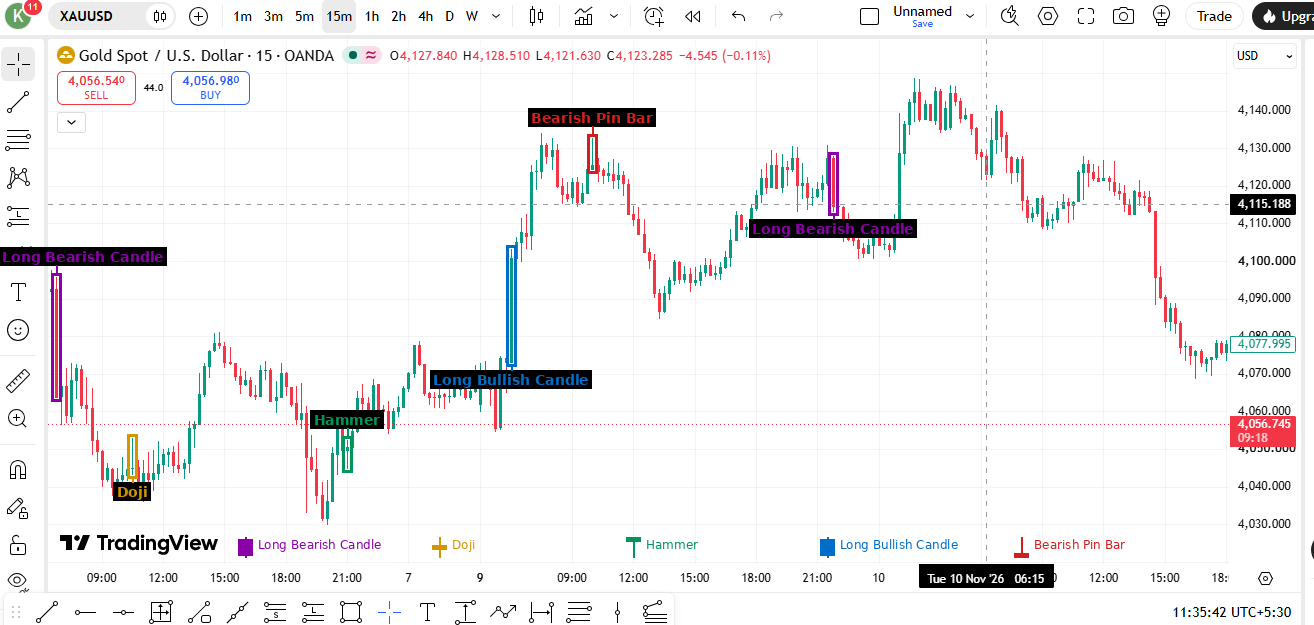
11 · XAUUSD · 15-minute
Gold: Hammer Rejection and Bearish Pin Bar at Resistance
Chart mein kya dikh raha hai: A Doji and Hammer are marked after a decline. A long bullish candle appears as price recovers, while a bearish Pin Bar and long bearish candle appear around a later high.
Market Psychology: The Hammer shows rejection of lower prices and is followed by a recovery in this sample. At the later high, the bearish Pin Bar signals that upward movement is being rejected.
Confirmation: A bullish close above the Hammer high supports the recovery idea. Near the later high, wait for a break below the bearish Pin Bar low before considering bearish follow-through.
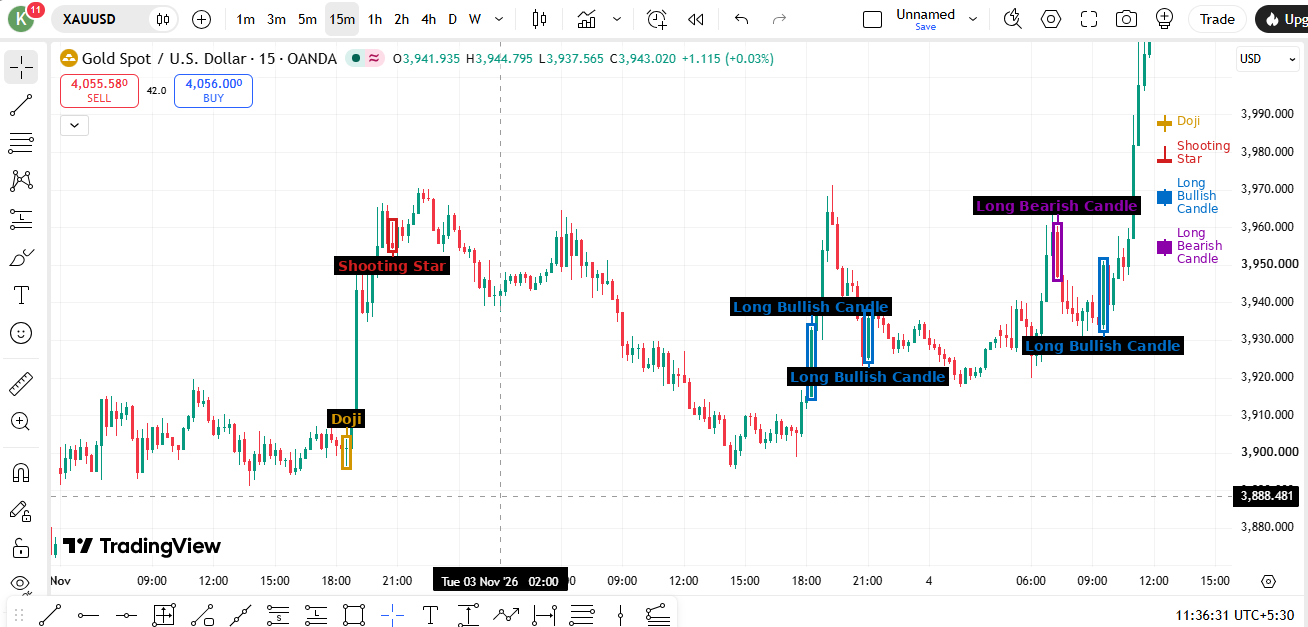
12 · XAUUSD · 15-minute
Gold: Shooting Star Rejection and Recovery Candles
Chart mein kya dikh raha hai: A Shooting Star is marked after an upward push, with a Doji appearing during the earlier range. Long bullish candles are marked as price later recovers from a decline; a long bearish candle appears during a pullback.
Market Psychology: The Shooting Star's upper wick shows rejection of higher prices. Later bullish impulse candles show buyers regaining momentum, while the bearish candle highlights that pullbacks can occur inside a recovery.
Confirmation: A bearish close below the Shooting Star low would strengthen the rejection case. For bullish continuation, look for price to hold a higher low and break the nearest swing high.
13 · XAUUSD · 15-minute
Gold: Bullish Rejection Followed by Upper-Wick Rejection
Chart mein kya dikh raha hai: A Doji appears near the left side, followed by long bullish candles and a bullish Pin Bar near a local low. After a strong rally, a Shooting Star and bearish Pin Bar are marked near the high, followed by a decline.
Market Psychology: Lower-wick rejection appears during the recovery, while upper-wick rejection appears after the rally. The sequence shows why the same candle family can have different implications depending on where it forms.
Confirmation: Look for a break above a nearby high after the bullish Pin Bar, and a break below the bearish Pin Bar low after the later rejection. Avoid entering before the candle closes.
14 · XAUUSD · 15-minute
Gold: Selling Pressure, Bullish Pin Bar and Trend Recovery
Chart mein kya dikh raha hai: A long bearish candle appears during a decline. A bullish Pin Bar is marked near the lower area, followed by a recovery. A Doji forms during consolidation before long bullish candles push price higher.
Market Psychology: The lower-wick rejection suggests sellers could not maintain control at the low. The Doji shows a pause during the recovery, and the later bullish candles show renewed buying momentum.
Confirmation: A higher low followed by a break above the consolidation high supports bullish continuation. If price falls below the Pin Bar low, the reversal idea is invalidated.
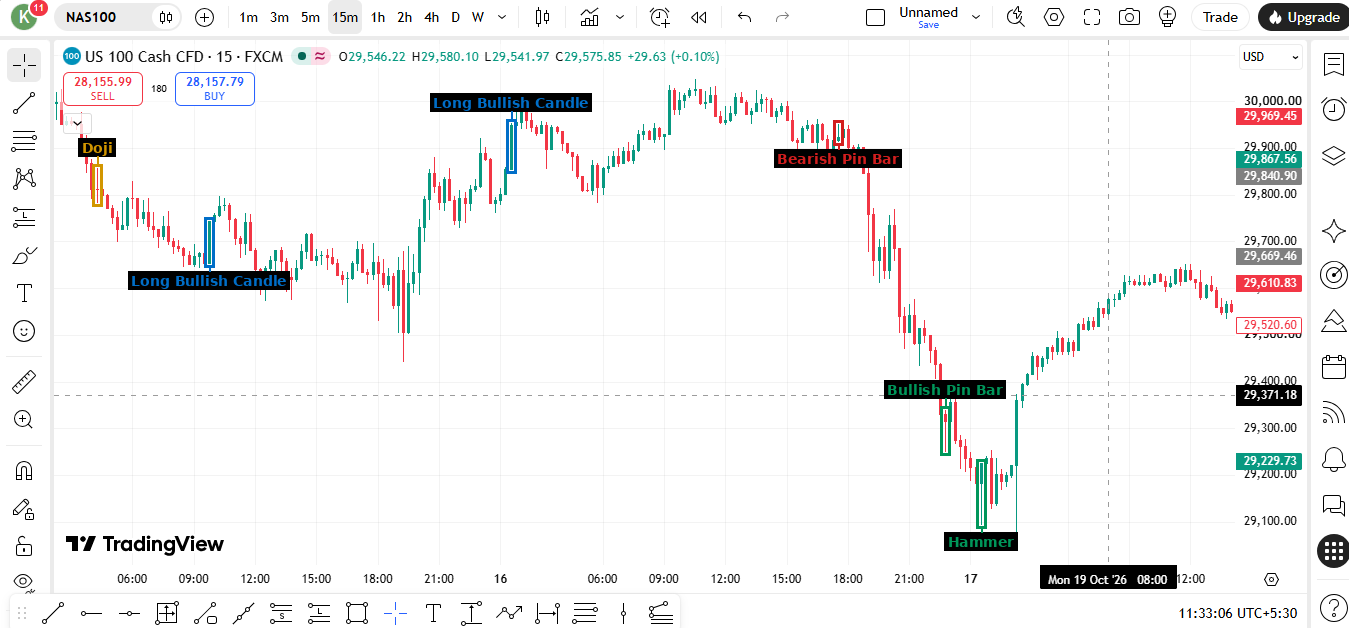
15 · NAS100 · 15-minute
NAS100: From Bearish Expansion to Bullish Reversal Signals
Chart mein kya dikh raha hai: A long bearish candle marks a sharp drop. A Hammer appears near a later low, while a Shooting Star and Doji are marked around a consolidation area. A bullish Pin Bar appears during the subsequent recovery.
Market Psychology: The initial bearish candle shows strong selling. The Hammer and bullish Pin Bar show lower prices being rejected at separate points, while the Shooting Star warns that an upward attempt can also meet selling pressure.
Confirmation: For a bullish reversal, wait for price to close above a nearby swing high after the lower-wick rejection. The Doji and Shooting Star need directional confirmation; neither is a standalone entry signal.
Trading Note: These screenshots are educational examples, not live trade calls or guaranteed outcomes. A candle pattern is more meaningful when it forms at a clear support/resistance area or swing point and is confirmed by the next candles and market structure. Risk management and a defined stop loss remain essential.
📊 Complete Pattern Reference — All 47 Patterns
#
Pattern Name
Type
Candles
Signal
Strength
1
Standard Doji
Single
1
Neutral
⭐⭐
2
Dragonfly Doji
Single
1
Bullish / context
Context-dependent
3
Gravestone Doji
Single
1
Neutral / context
Context-dependent
4
Long-Legged Doji
Single
1
Neutral / context
Context-dependent
5
Four Price Doji
Single
1
Neutral / context
Context-dependent
6
Hammer
Single
1
Bullish / context
Context-dependent
7
Inverted Hammer
Single
1
Bullish / context
Context-dependent
8
Hanging Man
Single
1
Bearish / context
Context-dependent
9
Shooting Star
Single
1
Bearish / context
Context-dependent
10
Bullish Marubozu
Single
1
Bullish / context
Context-dependent
11
Bearish Marubozu
Single
1
Bearish / context
Context-dependent
12
Spinning Top (Bullish)
Single
1
Bullish / context
Context-dependent
13
Spinning Top (Bearish)
Single
1
Bearish / context
Context-dependent
14
Bullish Belt Hold
Single
1
Bullish / context
Context-dependent
15
Bearish Belt Hold
Single
1
Bearish / context
Context-dependent
16
Bullish Engulfing
Double
2
Bullish / context
Context-dependent
17
Bearish Engulfing
Double
2
Bearish / context
Context-dependent
18
Bullish Harami
Double
2
Bullish / context
Context-dependent
19
Bearish Harami
Double
2
Bearish / context
Context-dependent
20
Bullish Harami Cross
Double
2
Bullish / context
Context-dependent
21
Bearish Harami Cross
Double
2
Bearish / context
Context-dependent
22
Tweezer Bottom
Double
2
Bullish / context
Context-dependent
23
Tweezer Top
Double
2
Bearish / context
Context-dependent
24
Piercing Line
Double
2
Bullish / context
Context-dependent
25
Dark Cloud Cover
Double
2
Bearish / context
Context-dependent
26
Bullish Kicker
Double
2
Bullish / context
Context-dependent
27
Bearish Kicker
Double
2
Bearish / context
Context-dependent
28
Bullish Meeting Lines
Double
2
Bullish / context
Context-dependent
29
Bearish Meeting Lines
Double
2
Bearish / context
Context-dependent
30
Morning Star
Triple
3
Bullish / context
Context-dependent
31
Evening Star
Triple
3
Bearish / context
Context-dependent
32
Morning Doji Star
Triple
3
Bullish / context
Context-dependent
33
Evening Doji Star
Triple
3
Bearish / context
Context-dependent
34
Three White Soldiers
Triple
3
Bullish / context
Context-dependent
35
Three Black Crows
Triple
3
Bearish / context
Context-dependent
36
Three Inside Up
Triple
3
Neutral / context
Context-dependent
37
Three Inside Down
Triple
3
Neutral / context
Context-dependent
38
Three Outside Up
Triple
3
Neutral / context
Context-dependent
39
Three Outside Down
Triple
3
Neutral / context
Context-dependent
40
Bullish Abandoned Baby
Triple
3
Bullish / context
Context-dependent
41
Bearish Abandoned Baby
Triple
3
Bearish / context
Context-dependent
42
Three Line Strike (Bullish)
Multi-candle
4
Bullish / context
Context-dependent
43
Three Line Strike (Bearish)
Multi-candle
4
Bearish / context
Context-dependent
44
Upside Gap Two Crows
Multi-candle
4
Bearish / context
Context-dependent
45
Stick Sandwich
Multi-candle
4
Bullish / context
Context-dependent
46
Advance Block
Multi-candle
4
Bearish / context
Context-dependent
47
High Wave Candle
Multi-candle
4
Neutral / context
Context-dependent
Pattern ki strength market context par depend karti hai; yeh fixed statistical rating nahi hai. Signals ko market structure, location, candle close aur risk management ke saath confirm karein. Yeh educational examples hain, trade recommendations nahi.