Support & Resistance
Build a clear foundation in support and resistance: identify price zones, understand horizontal and diagonal levels, read bounces and breakouts, and plan risk. This is a beginner course—not a signal service or a set of guaranteed trade setups.
By the end of this chapter, you should be able to
- Explain the difference between support and resistance.
- Mark a zone using visible swing highs and swing lows.
- Recognise horizontal levels, trendlines, channels, and possible role reversal.
- Describe a bounce, breakout, retest, and false breakout without assuming the next move.
- Plan an invalidation point, target area, and position size before a trade.
What you will learn in this chapter
This chapter focuses on the foundations of Support & Resistance: horizontal zones, swing highs and lows, trendline support and resistance, role reversal after a breakout, and basic trade planning. Advanced ICT/SMC methods are intentionally kept for the VIP Academy.
Educational examples only. Support and resistance are areas of interest—not predictions. Always assess the current chart and manage risk.
What is Support & Resistance?
Support and Resistance are areas on a chart where price has previously paused, reversed, or struggled to move through. They reflect areas of changing buying and selling interest. A reaction can happen, but no level guarantees a reversal.
SUPPORT
An area below or near current price where buying interest has previously been strong enough to slow or reverse a decline. Price may bounce, pause, or break through it.
RESISTANCE
An area above or near current price where selling interest has previously slowed or reversed a rise. Price may reject the area, pause, or break above it.
Illustrative example only: price reacts more than once at each zone. There is no minimum touch count.
Remember: S&R are ZONES, not exact lines. Price can slightly overshoot before reversing. Treat them as areas rather than exact prices. Their width depends on the instrument, timeframe, volatility, and recent price structure; there is no universal pip width.
How to Identify S&R on a Chart
Use these four steps to build a consistent chart-reading process:
Switch to Higher Timeframe
Start with a timeframe that fits your trading horizon. Daily and H4 charts can help identify broader areas; intraday traders may also use H1 or M15 for context. Higher-timeframe areas are often more visible, but they can still fail.
Find Swing Highs & Swing Lows
Look for price peaks (swing highs = resistance) and price valleys (swing lows = support). These are natural turning points in the market.
Mark Levels with Multiple Touches
Look for clear swing points and meaningful reactions. Two or more reactions can make an area easier to recognise, but do not treat a fixed touch count as proof. Repeated tests can also weaken a level.
Drop to Lower Timeframe for Entry
If you need a closer view, move to a lower timeframe to study candle closes and the way price reacts. A lower timeframe adds detail, not certainty.
Connect Swing Highs → Resistance Line | Connect Swing Lows → Support Line
Types of S&R Levels
1. Horizontal S&R
COMMON TYPEHorizontal zones are areas around previous swing highs or lows where price has reacted. Repeated reactions can make a zone easier to notice, but each test may also weaken it; touch count alone does not measure strength.
2. Diagonal Support, Resistance & Channels
A rising trendline can act as dynamic support when it connects meaningful higher swing lows. A falling trendline can act as dynamic resistance when it connects meaningful lower swing highs. Two roughly parallel trendlines can outline a channel. Treat these as guides, not exact barriers: price can break or move around them.
3. Role Reversal (S&R Flip)
POSSIBLE ROLE CHANGEAfter a clear break, the old resistance may act as support—or old support may act as resistance—if price returns to the area. This role change is possible, not automatic, and a retest can fail.
3. Round Number Levels
Prices like 1.2000, 150.00 act as natural S&R. Strongest when aligned with horizontal S&R.
Practical Support & Resistance Chart Lab
Study how the marked areas relate to actual price movement. These NAS100 screenshots are worked examples of horizontal zones, range boundaries, diagonal trendlines, and basic trade planning. They are historical illustrations, not live market calls. Focus on the price behaviour around each area—not on copying a trade blindly.
Example 1 — Horizontal Resistance Breakout
Horizontal zone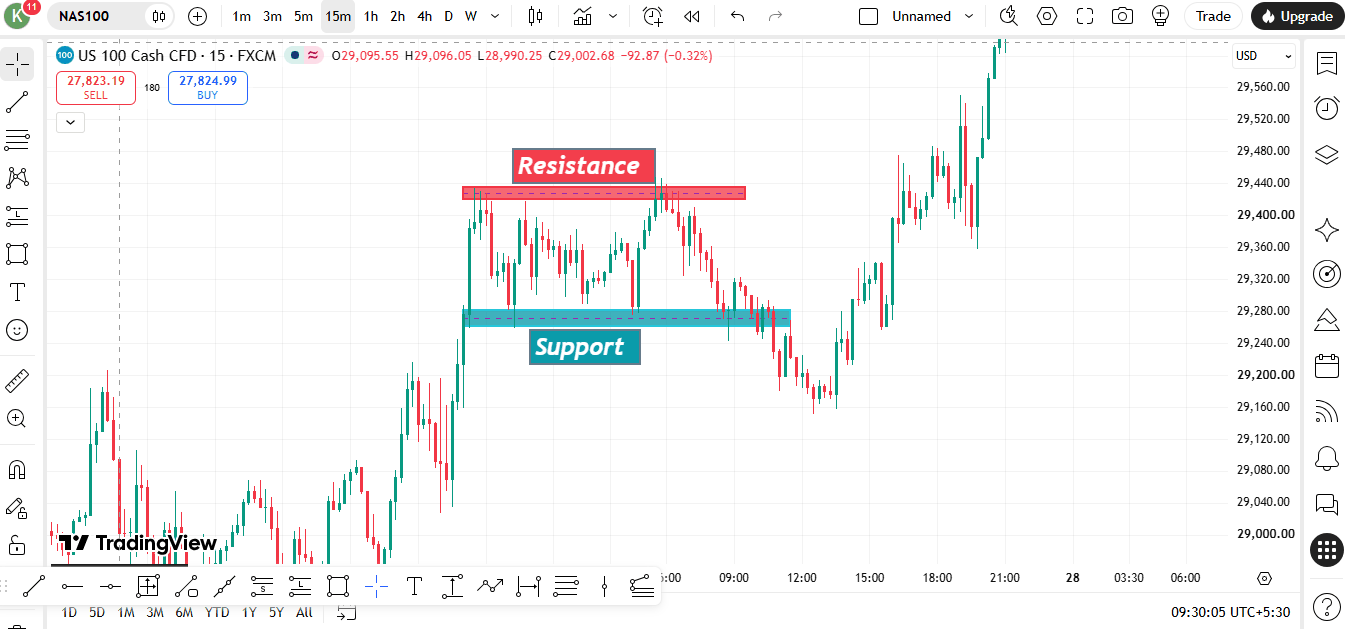
Tap the chart to open the full-size image.
The red area marks a price region where previous highs created resistance. The teal area below marks a region where price previously found support. In this example, price later moves above the resistance zone. A move above a zone is a breakout candidate, not automatic proof of a lasting trend change.
What to learn
- Mark the resistance as an area around the prior highs, rather than drawing an overly precise line.
- Watch whether a candle closes beyond the zone; a brief wick through it can fail.
- After a breakout, observe whether price holds above the old resistance or falls back into the range.
Example 2 — Trading Range: Support and Resistance
Range structure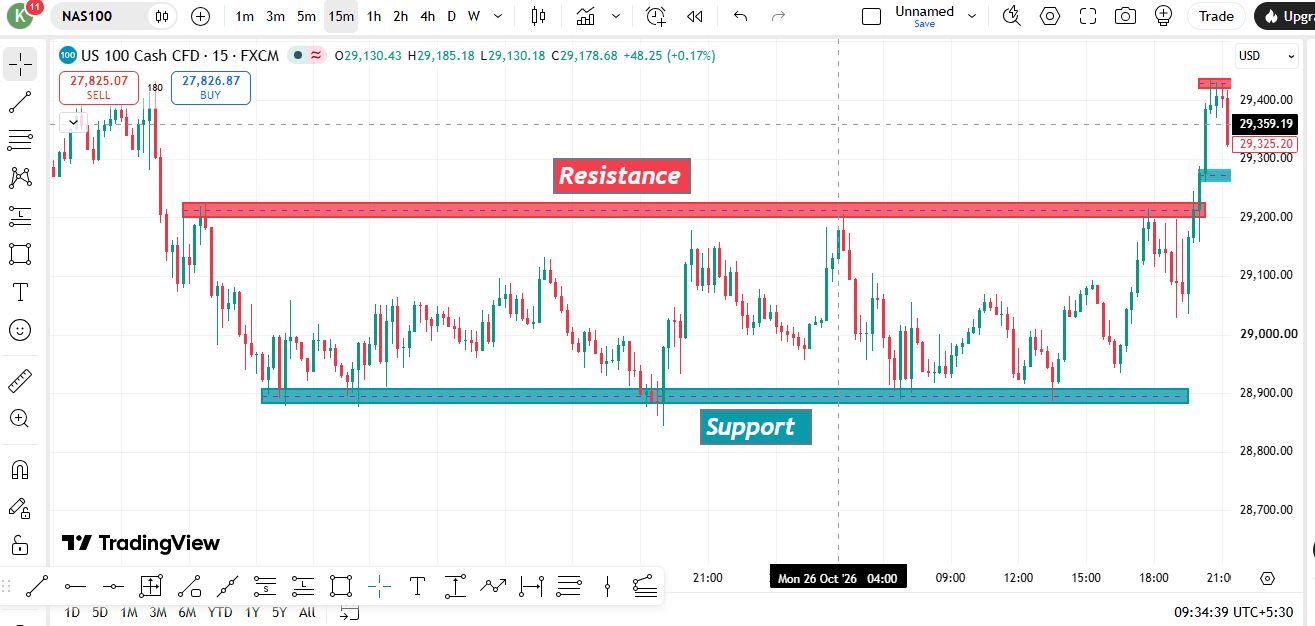
Tap the chart to open the full-size image.
Price is shown moving between an upper resistance area and a lower support area. This is a trading range: neither side has established a sustained move beyond the boundaries during the earlier part of the example. The later push above resistance shows how a range can eventually resolve.
What to learn
- Identify the upper and lower boundaries using repeated, visible reactions.
- Inside a range, price can reverse before reaching the exact edge; allow for a zone.
- A breakout may continue, but false breaks happen. Avoid chasing the first candle without a plan.
Example 3 — Diagonal Support and Resistance
Trendline channel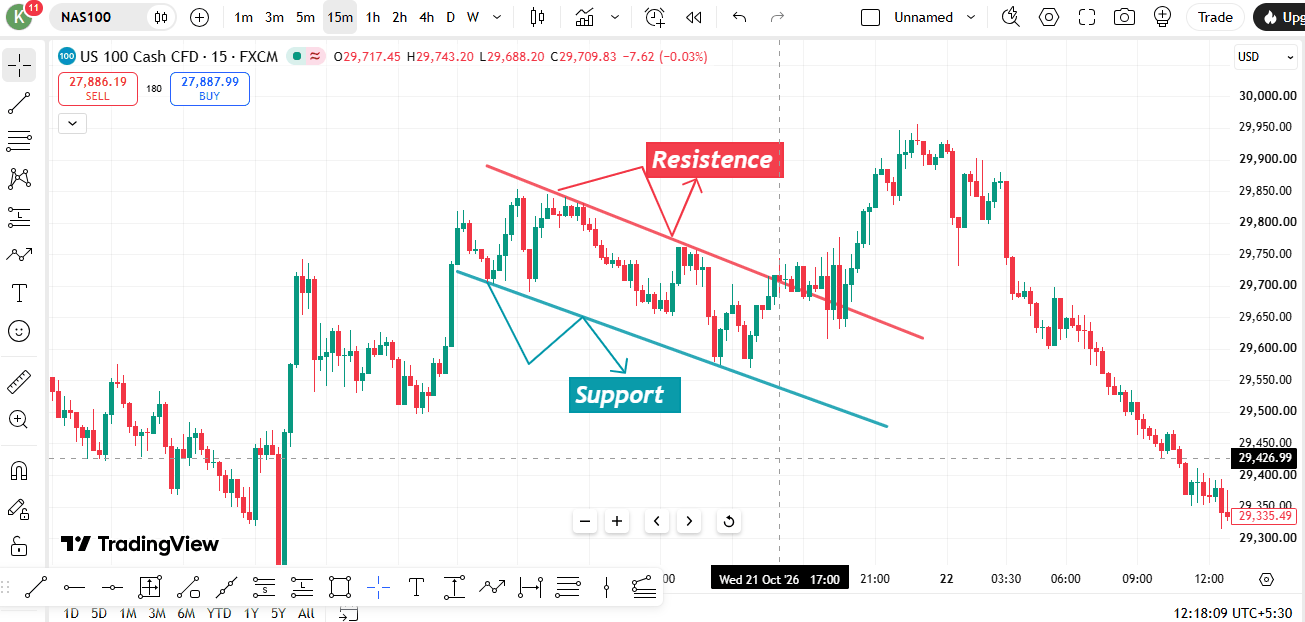
Tap the chart to open the full-size image.
This chart illustrates diagonal support and resistance drawn around a descending price channel. The upper trendline connects lower swing highs and acts as dynamic resistance; the lower trendline connects lower swing lows and acts as dynamic support. Price moves within the channel before breaking below the lower boundary in this example.
What to learn
- Draw trendlines through meaningful swing points; do not force a line to fit every candle.
- A channel gives a visual guide to the slope and boundaries of a move.
- A break below the lower trendline can signal a change in behaviour, but wait for price confirmation and assess the wider chart.
Example 4 — Planning a Trade Around a Key Zone
Illustrative setup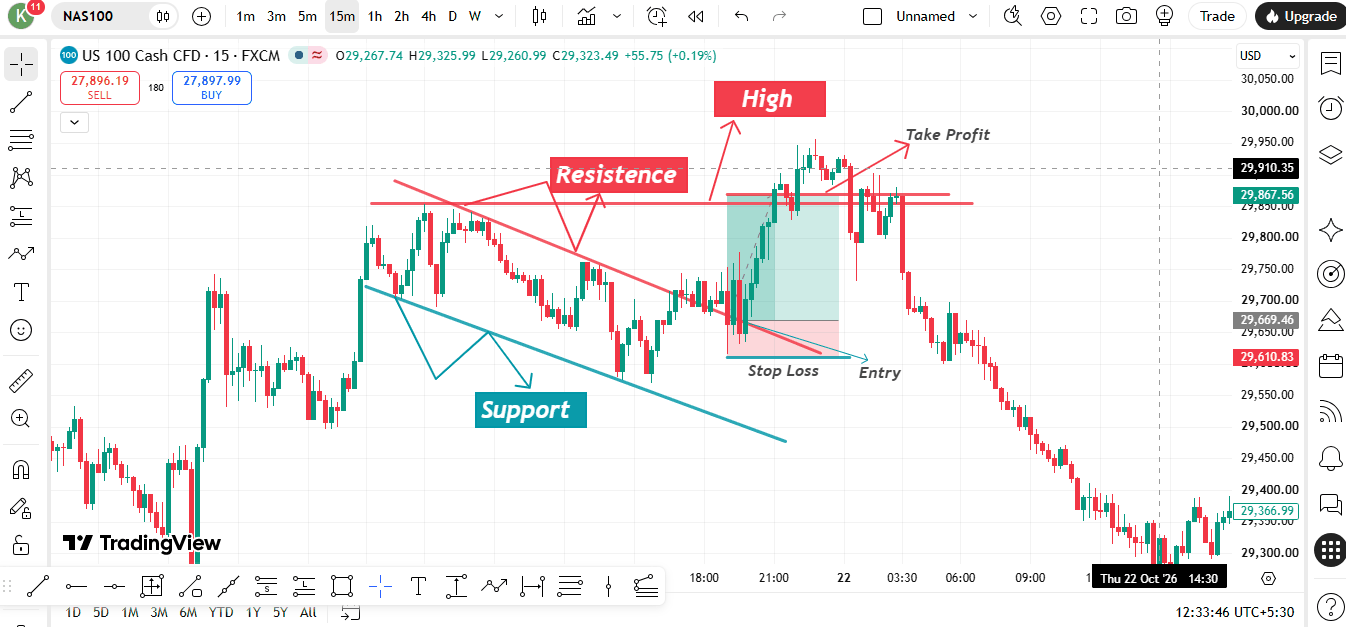
Tap the chart to open the full-size image.
This annotated example shows how a trader can organise a plan around a marked price area, including a possible entry, an invalidation point for the stop loss, and a target. The later price movement in the screenshot is historical chart behaviour; it does not mean the same setup will produce the same result in another market condition.
What to learn
- Define the trade idea before entry: what price behaviour would support it?
- Place the stop beyond the price area that invalidates the idea, accounting for volatility and spread.
- Choose a target using the next relevant chart area and check whether the potential reward justifies the risk.
- If the setup is unclear or the available reward is too small, skipping the trade is a valid decision.
These screenshots are educational chart examples, not live signals or financial advice. Chart conditions change, and no support or resistance area guarantees a bounce, breakout, or profitable trade.
How Price Reacts to Support & Resistance
Bounce Trade — Buy at Support / Sell at Resistance
Wait for price to reach the marked area. Then assess whether it rejects the zone, closes through it, or remains indecisive. A candle pattern can be context, but it is not a standalone guarantee.
Mark the area on a timeframe that suits your trading horizon
Wait for price to reach that level
See rejection candle (pin bar / engulfing)
Only consider an entry after price behaviour supports your plan
Place the stop where the trade idea is invalidated, allowing for the instrument’s normal volatility and spread. The distance is not a fixed pip amount.
Breakout & Retest — Enter after flip
Wait for price to break through a level with strong momentum, then retest that flipped level before entering.
Price breaks above resistance with big candle
DO NOT chase — wait for retest of old resistance
Old resistance now acts as support → Enter BUY
Place the stop beyond the point that invalidates the trade idea
False Breakout (Trap Trade)
A false breakout happens when price moves beyond a range boundary but then returns and closes back inside the range. This can happen in either direction. Wait for the candle close and assess the wider chart; a return inside the range is not, by itself, a guaranteed reversal signal.
Risk Management Rules
Stop Loss Rules
Place the stop beyond the area or structure that would invalidate the setup. Set the distance according to the chart and instrument; avoid a universal pip rule.
Do not move the stop without a rule in your trading plan; premature changes can also affect the original risk.
If price reaches the invalidation point, follow the predefined exit plan rather than widening the stop.
Take Profit Rules
Check whether the next meaningful price area offers enough room relative to the stop distance. A 1:2 ratio is not suitable or available on every setup.
TP at the next major S&R level opposite side
A partial exit is optional; define the exit plan before entering and base it on the chart.
Position Sizing
Choose a small, predefined risk amount that fits your circumstances and trading plan. Many traders use a low percentage, but no single figure is right for everyone.
Calculate lot size based on SL distance
Never increase position to recover losses
Best Trading Times
Session activity varies by instrument and daylight-saving time. Review the instrument’s own active hours rather than assuming one session is always best.
Check the relevant market hours and scheduled news. Avoid trading solely because a session has opened.
Major scheduled announcements can increase spreads, volatility, and slippage. Decide in advance whether your strategy avoids those events; there is no single time window that suits every instrument.
Chapter 1 — Complete Summary
Support = Floor (Buyers), Resistance = Ceiling (Sellers)
Always treat S&R as zones, not exact lines
A level with repeated reactions is easier to identify, but repeated tests can weaken it. Evaluate the quality of each reaction and the broader context.
After a decisive break, the old resistance may act as support—or the old support may act as resistance—if price returns and respects the area. The retest can fail.
Choose chart timeframes that match your holding period and execution plan.
Plan the stop and target from the actual chart, then calculate position size from the risk amount you have chosen. Skip trades where the available target does not justify the risk.
Round numbers can attract attention, but their importance varies by instrument and context.
Check instrument-specific trading hours, spread, volatility, and scheduled events. A session opening alone is not an entry signal.
Final Practice — Read the Chart
Open any liquid instrument on your charting platform and use a timeframe that suits your plan. Mark one support zone and one resistance zone, then answer these questions in your own notes:
- Which visible swing points helped you mark each zone?
- Did price bounce, pause, break through, or return to the zone?
- What price action would invalidate your trade idea?
- Where is the next meaningful area that could act as a target?
- Does the potential reward justify the risk—or is skipping the trade better?
There is no required trade. The goal is to practise clear, evidence-based chart reading.